
I just wanted to reiterate that I maintain the same price targets on QQQ & IWM that have been highlighted on the weekly charts since late last year around the time those higher-beta indices peaked. While additional targets will likely be added to IWM & quite possibly QQQ as well, below are the updated weekly charts along with the previous static (screenshot) chart posted a month ago today when QQQ hit my first price target & a tradeable bounce was expected (and since ensued).

QQQ weekly Jan 24th

QQQ weekly Feb 24th
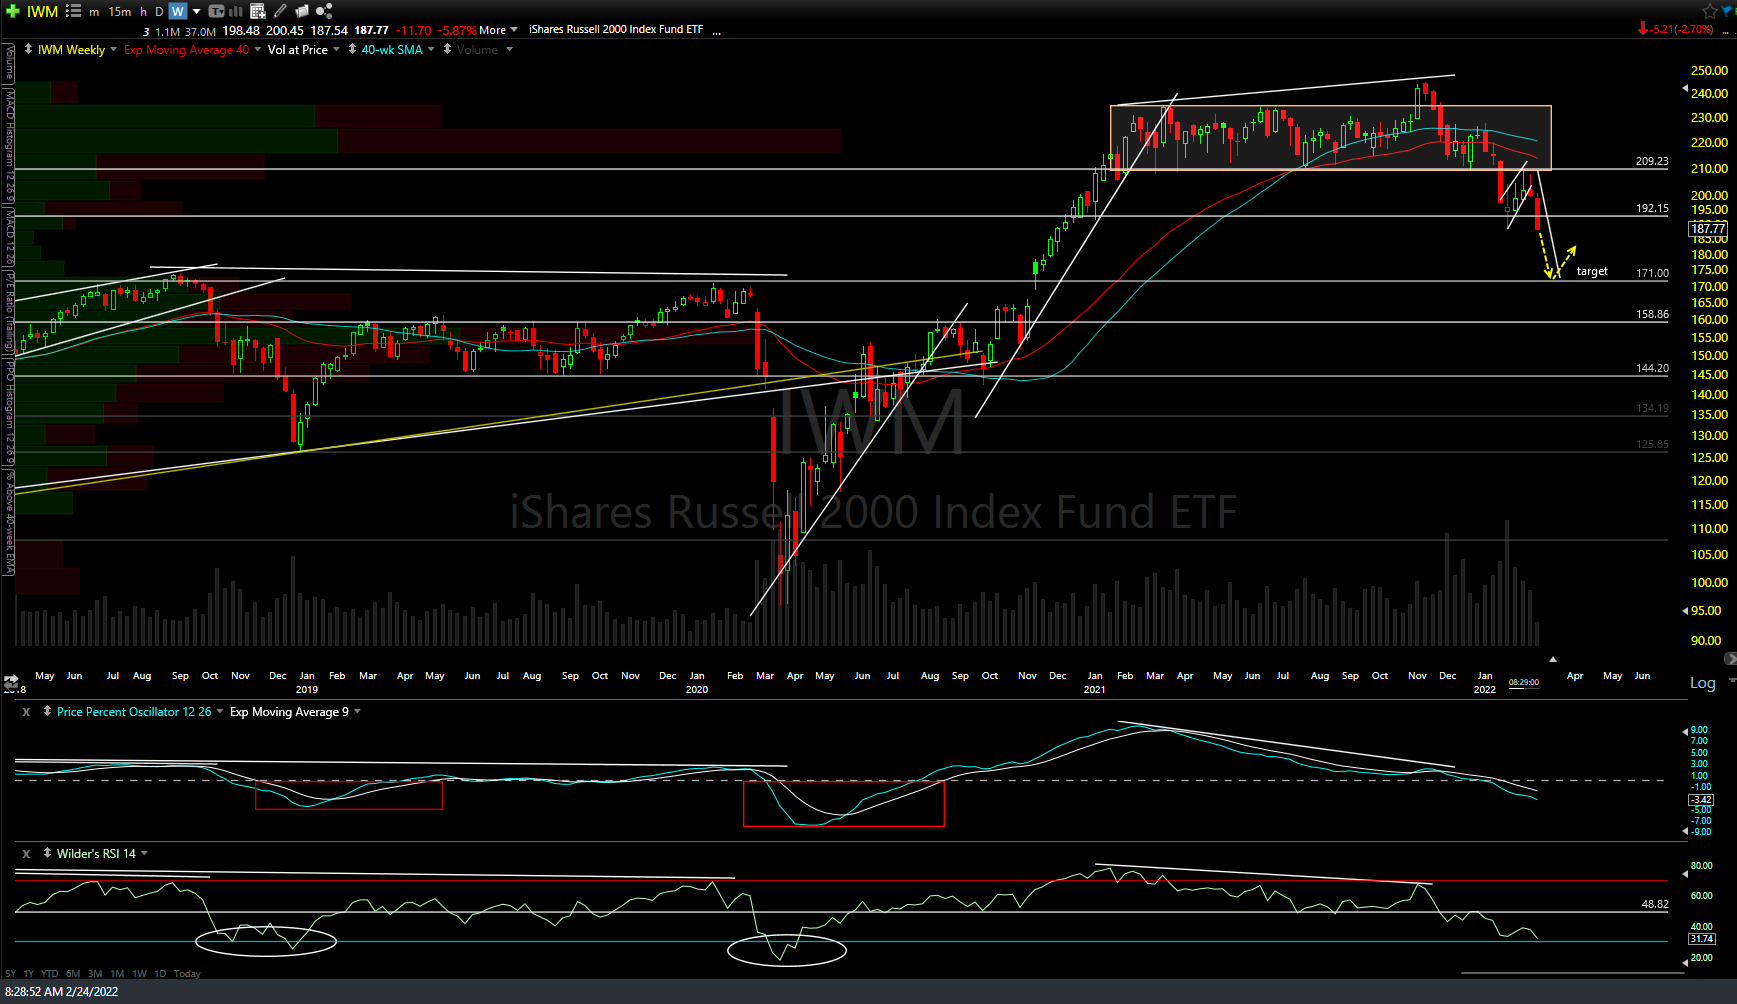
IWM weekly Feb 24th
Swing traders that reversed from short to long when T1 was hit & recycled back in short again any or all of the objective short re-entry levels highlighted have already made much more than the 16%+ drop from the initial short entries just off the all-time highs in QQQ. Hence, the benefit of active trading.
If/as we approach the next targets on IWM & QQQ I will share my thoughts on how likely a reaction seems based on the posture of the charts at the time. While at this time, a reaction off the initial tag of T2 on QQQ (assuming it is hit soon) is likely, there is a somewhat decent chance that the Q’s could slice through that (rough) support of around 299-300 with little to no reaction. As such, one might opt to either cover (and reverse to long, if attempting to trade a bounce) and/or lower or trail down stops if & as QQQ approaches T2.
The potential benefit to the first strategy (closing out a QQQ or /NQ short or an SQQQ long) is to lock in profits & not risk a giveback, should the market suddenly & swiftly reverse although that strategy could also leave profits on the table, should the market slice through that support & continue down towards T3 or T4. The potential benefit to the latter strategy is allowing for the potential for larger gains while the downside is the possibility of giving back some profits, should the markets bounce & with your stop-loss order being triggered.
For those short /NQ, 12200ish is the comparable second target that aligns with T2 on QQQ. Daily chart below (disregard those divergent highs & lows, they carried over from the 60 & 120-min time frames). Those trading TZA or /RTY in lieu of an IWM short might consider setting a price alert somewhat above the 170 price target if you plan to book profits and/or reverse long if/when that target is hit. Also, note that these are what I refer to as ‘unadjusted’ price targets, meaning they are the actual support levels where a reaction is likely upon the initial tag. As such, one might opt to either book profits slightly above those levels or tighten up stops if/as IWM & QQQ begin to approach those levels from above, as it is fairly common to see downside (short trades) price targets briefly overshot when the security is in a steep & sharp decline, what I refer to as a momentum-fueled overshoot.

NQ daily Feb 24th