In just over a week, the Nasdaq 100 (QQQ) has dropped 1.5% while the Russell 2000 Small Cap Index (IWM) has rallied 1.75%, a very unusual disparity of 3.25% between the two in such short order which is likely to end with a reversion to the mean very soon (i.e.- QQQ up and/or IWM down).

IWM SPY & QQQ comparison Sept 22nd
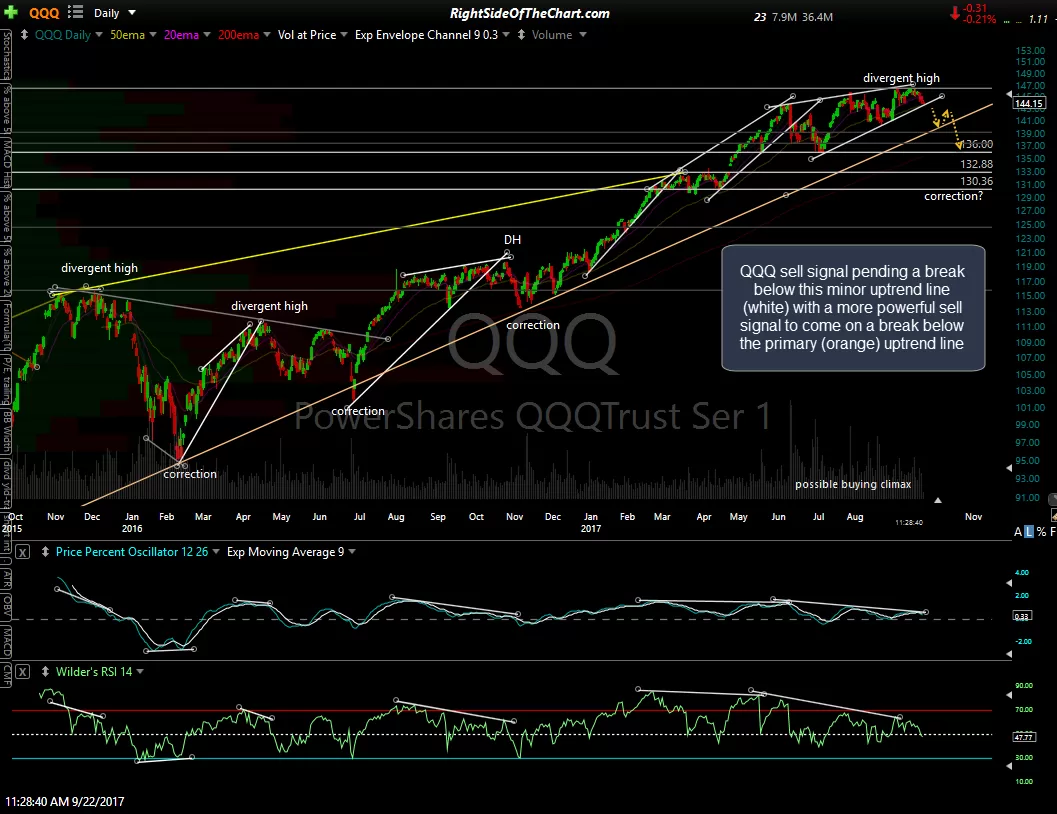
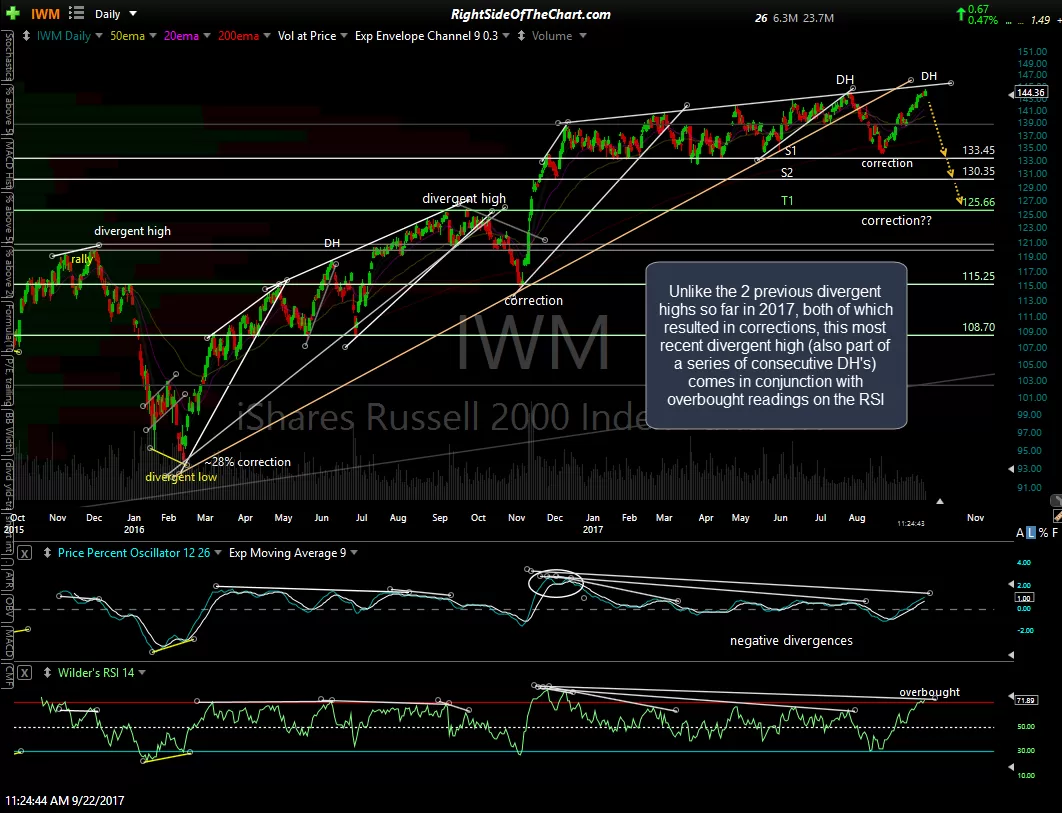
QQQ is at support on both the 60-minute time frame (144 horizontal price support) as well as trendline support on the daily chart, so the odds for a reaction here are decent. However, from the look of the charts, it appears that IWM is likely to underperform QQQ (i.e.- fall more or rise less) in the coming days/weeks. Unlike the 2 previous divergent highs on IWM so far in 2017, both of which resulted in corrections, this most recent divergent high (also part of a series of consecutive DH’s) comes in conjunction with overbought readings on the RSI . QQQ sell signal pending a break below this minor uptrend line (white) with a more powerful sell signal to come on a break below the primary (orange) uptrend line.
-
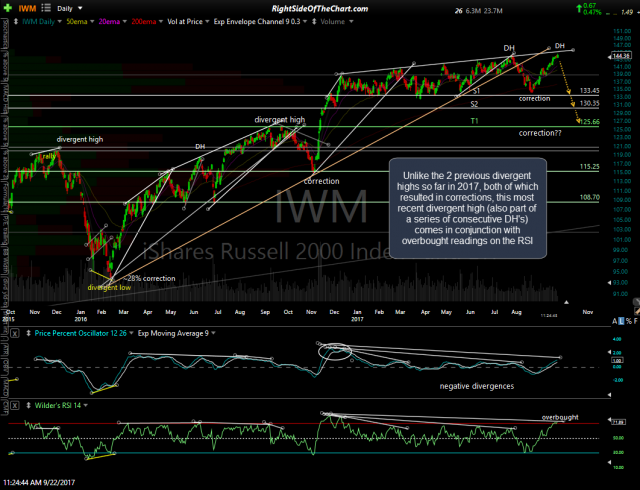
- IWM daily Sept 22nd
-
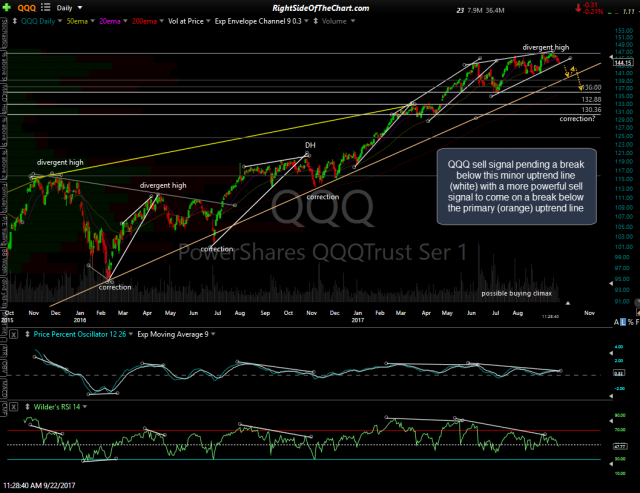
- QQQ daily Sept 22nd