
Here’s a quick look at some potential cross-currents on the intraday charts of QQQ, which was just added back as a new Active Short Trade earlier today. In recent updates focusing on the 60-minute time frame, I had pointed out the divergent high that was put finalized at the top of last week’s Fed-induced rally, followed by an impulsive reversal & breakdown below the minor uptrend (sell signal #1) and subsequently backtest (objective short entry #2) and failure at that trendline from below.
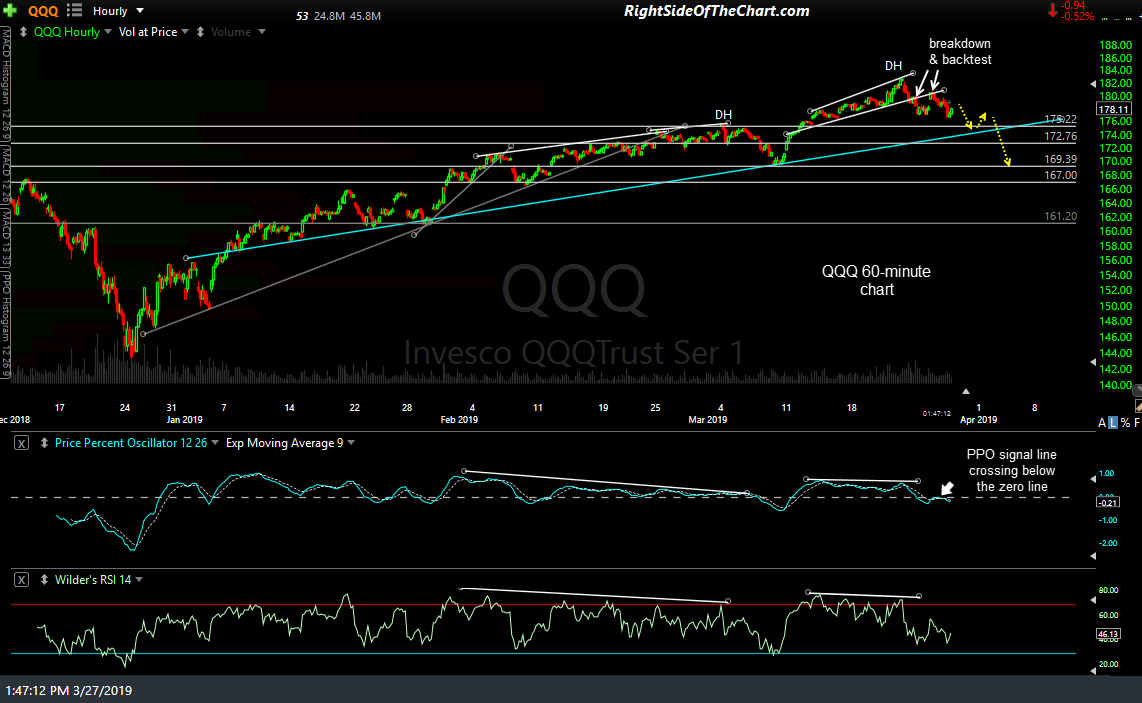
QQQ 60-min 2 March 27th
Zooming down to the 15-minute timeframe below, QQQ just recently kissed & reversed off the top of a support zone that runs from about 176.56 down to 175.79, the top of which is defined by the top of the March 13th gap. The reversal that has so far followed the test of the top of that gap has confirmed bullish divergences (via a bullish crossover on the PPO) that were already forming on the 15-minute time frame along with a bullish falling wedge pattern that appears to be developing.
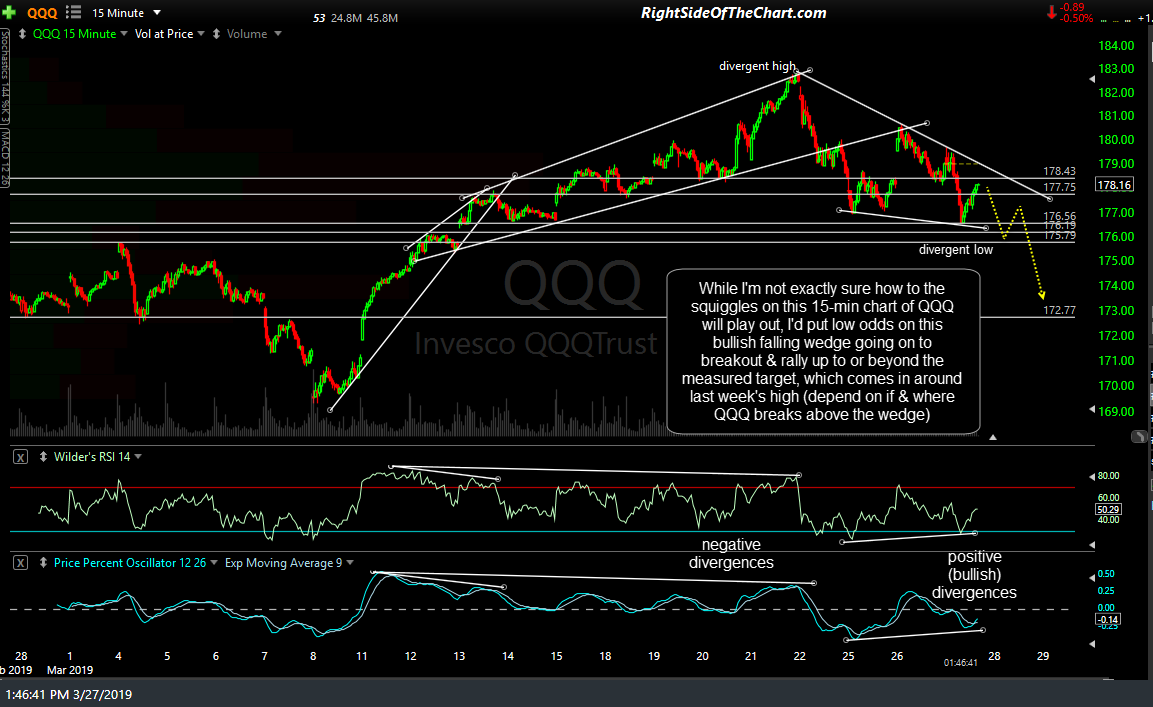
QQQ 15-min March 27th
So essentially, we have conflicting technicals (bullish & bearish) on the intraday time frames and while the downtrend line on that 15-minute falling wedge pattern may certainly spark a rally if taken out impulsively, my expectation would be that any breakout above that pattern that might occur within the next day or two would most likely prove to be a false breakout.
It is not uncommon to see both bullish and bearish technicals on the same stock, index, ETF, etc. at the same time on different time frames. However, the important thing to factor into your analysis is that the longer the time frame (e.g.- weekly vs. daily; daily vs. 60-minute; etc.), the more significant the developments & as such, I will apply a higher weighting to the longer-term charts.
In this case, not only is QQQ just recently coming off a much larger divergent high on the more significant 60-minute chart (the scope/duration of those negative divergences are larger than the positive divergences on the 15-minute chart) but QQQ also recently put in a divergent high on the much more significant daily chart as well (PPO divergence with the RSI at extreme overbought readings).
As such & while there are absolutely no guarantees, that indicates to me that the bullish divergences & potential bullish falling wedge pattern are less likely to play out for as much of a rally as they might normally if QQQ hadn’t recently put in the divergent highs on those more significant time frames.