
With a low of 269.28 so far, QQQ is getting close enough to that 3rd target/support level to warrant covering short positions and/or starting to scale into longs for those that were/are looking for a tradable bounce off T3 (my preference at this time) while those holding out for a continued move lower down to the 4th & final price target should consider lowering stops to protect profits. Weekly chart below.
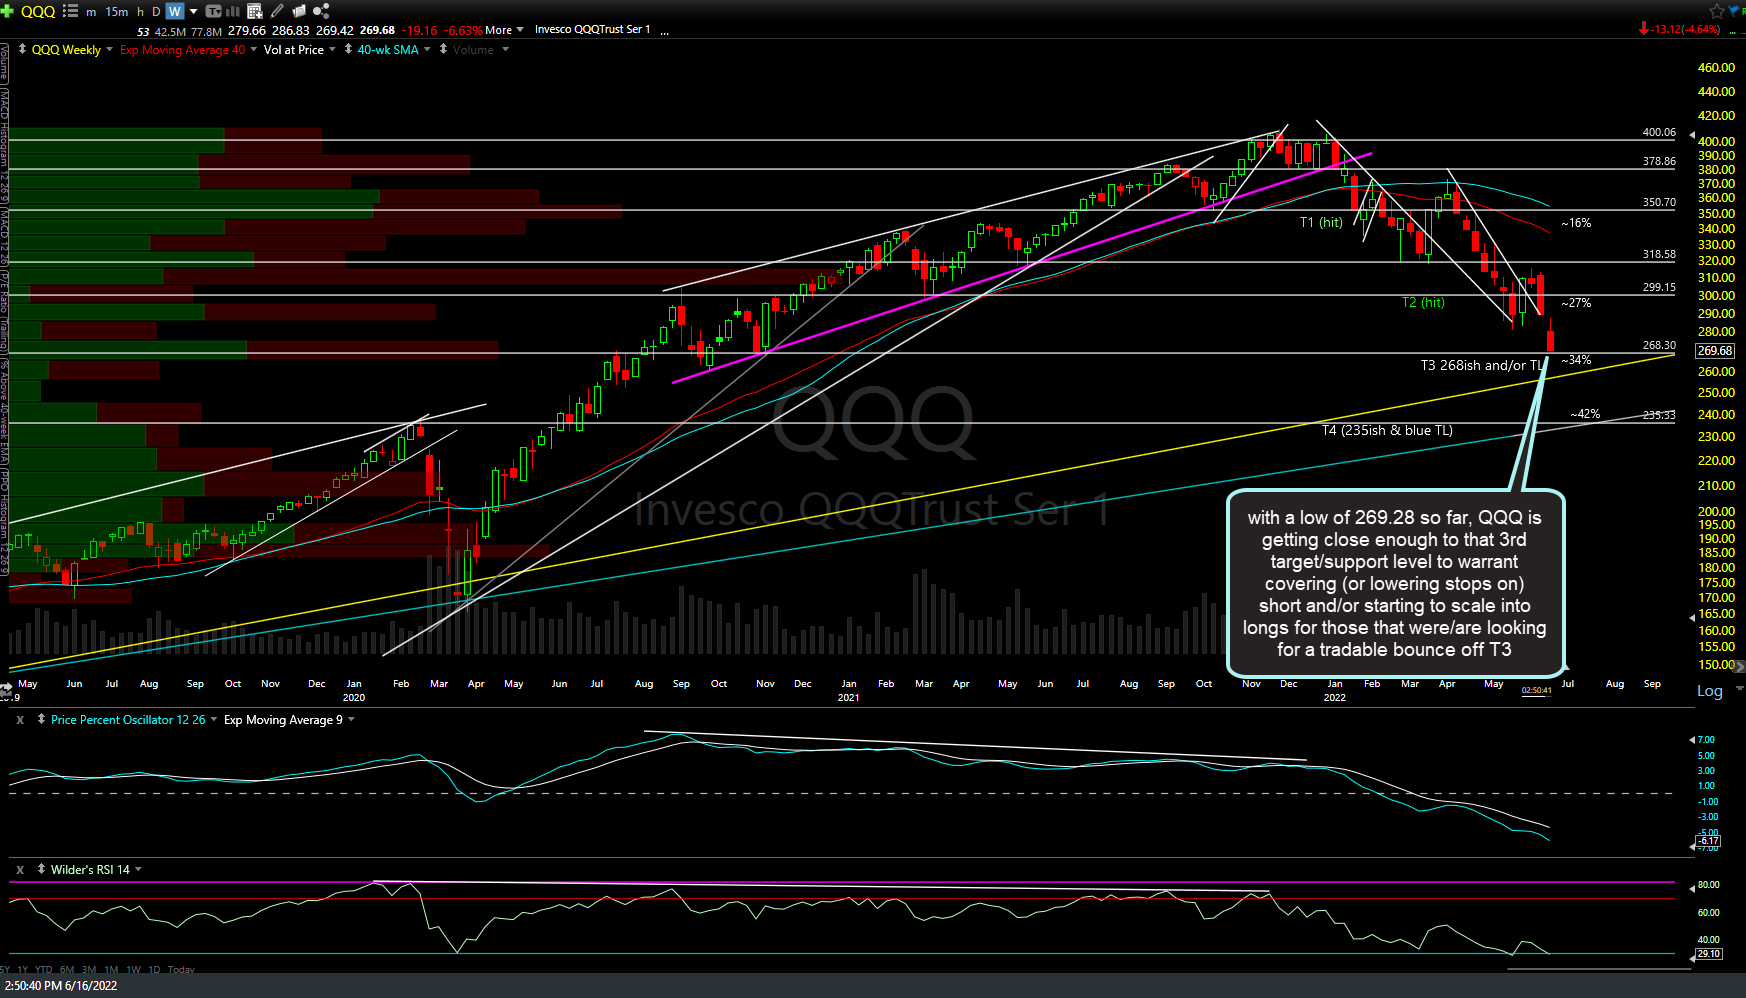
QQQ weekly June 16th
Zooming down to the 60-minute chart of /NQ (Nasdaq 100 futures), the positive (bullish) divergences continue to build on the 60-minute & daily charts of QQQ as it approaches T3 on the weekly chart. While continued downside to T4 is certainly a possibility, at this time I would put somewhat more favorable odds for a meaningful (i.e.- swing tradable) rally off or around current levels (60-70%) vs. a continued drop to T4 (30-40%). I just covered all shorts & started to scale into index longs here at the hit of T3, I plan to add to those positions if we get some early buy signals which would come on a recovery back above 11290 & even better above 11535 on this /NQ 60-minute chart below.
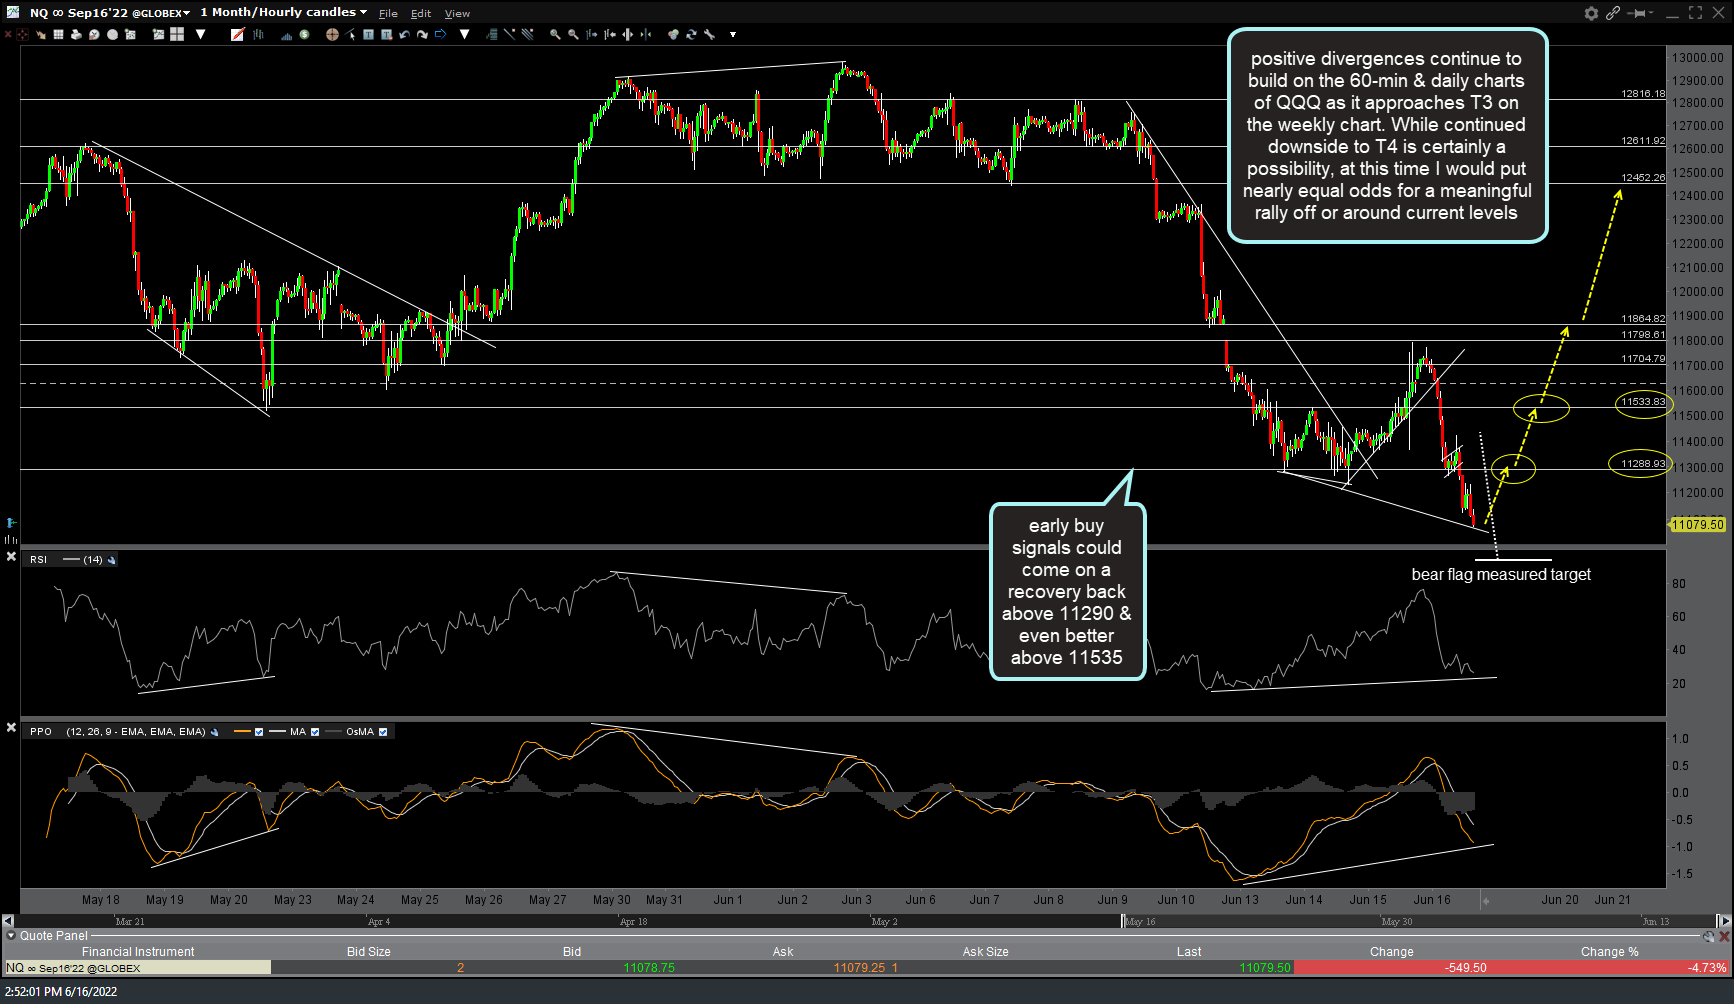
NQ 60m 4 June 16th