
QQQ has gapped above the 60-minute bullish falling wedge pattern that was highlighted in Friday’s video with the positive divergences still intact, thereby triggering a buy signal. T3 (274.91) was former support that is now resistance. As such, the next buy signal will come on a solid break above T3 with a sell signal on a solid break below T4 (the recent lows) which was hit & contained the correction so far.
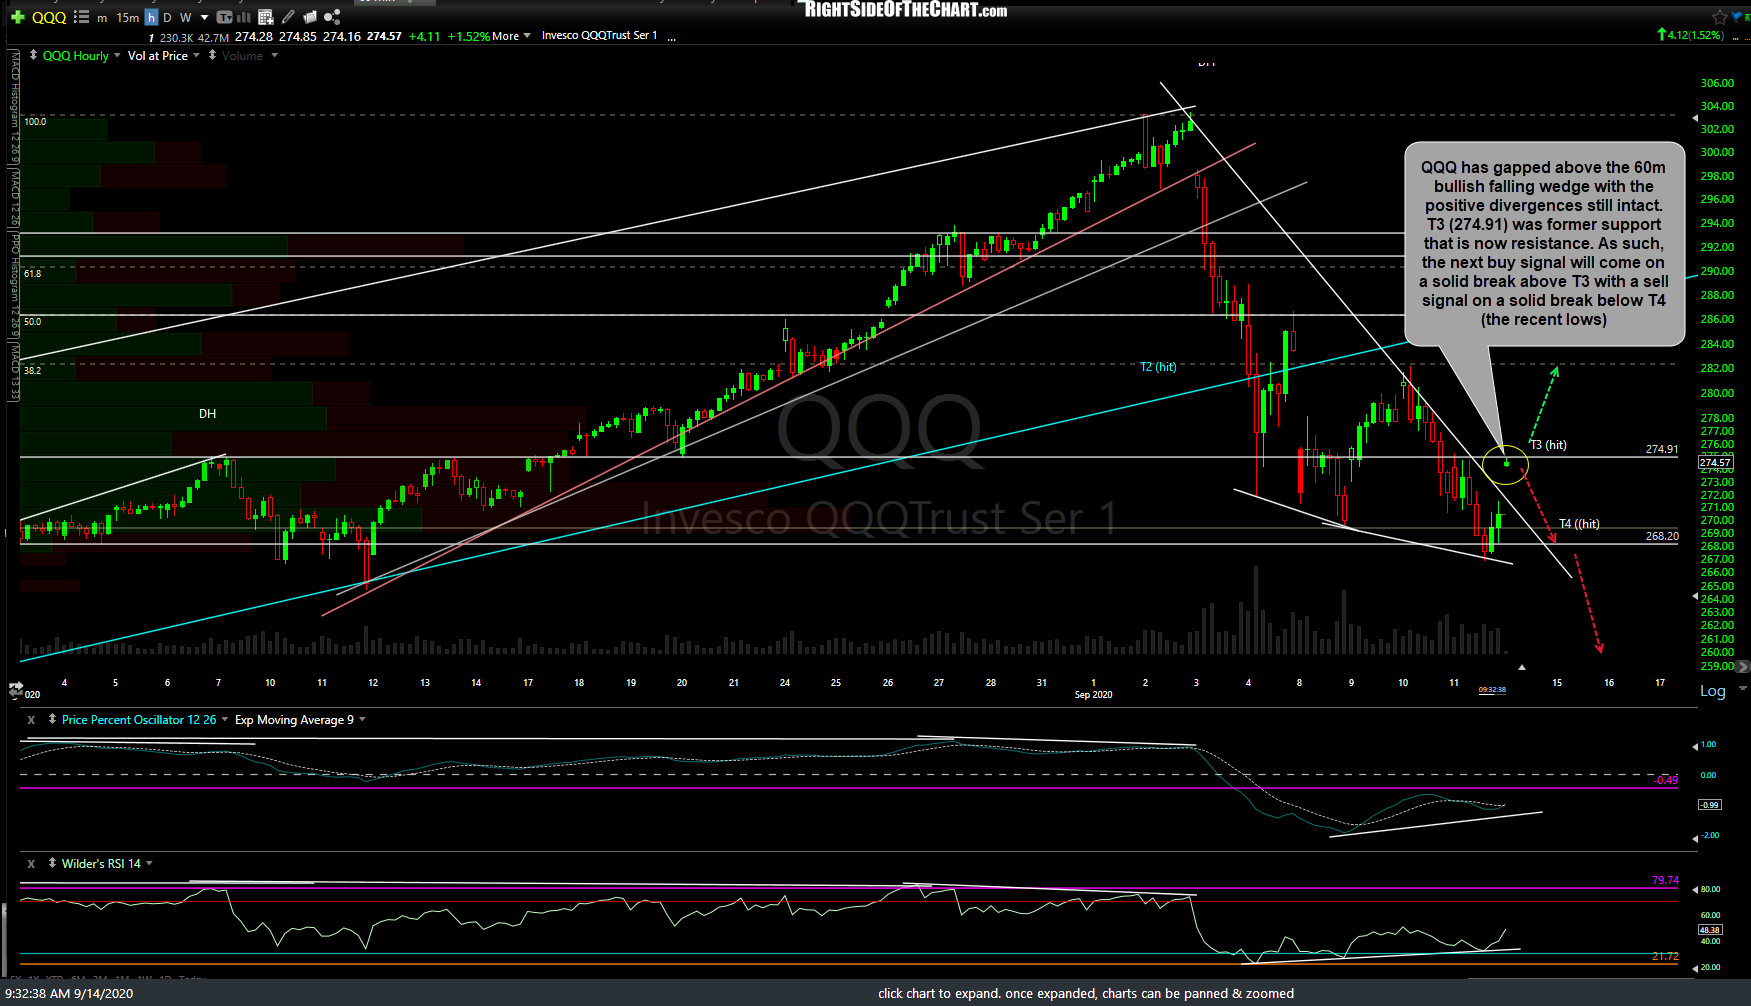
QQQ 60m Sept 14th
/NQ (Nasdaq 100 futures) is trading in the middle of the recent trading range (box) with a solid break above or below the range likely to determine the next tradable trend.
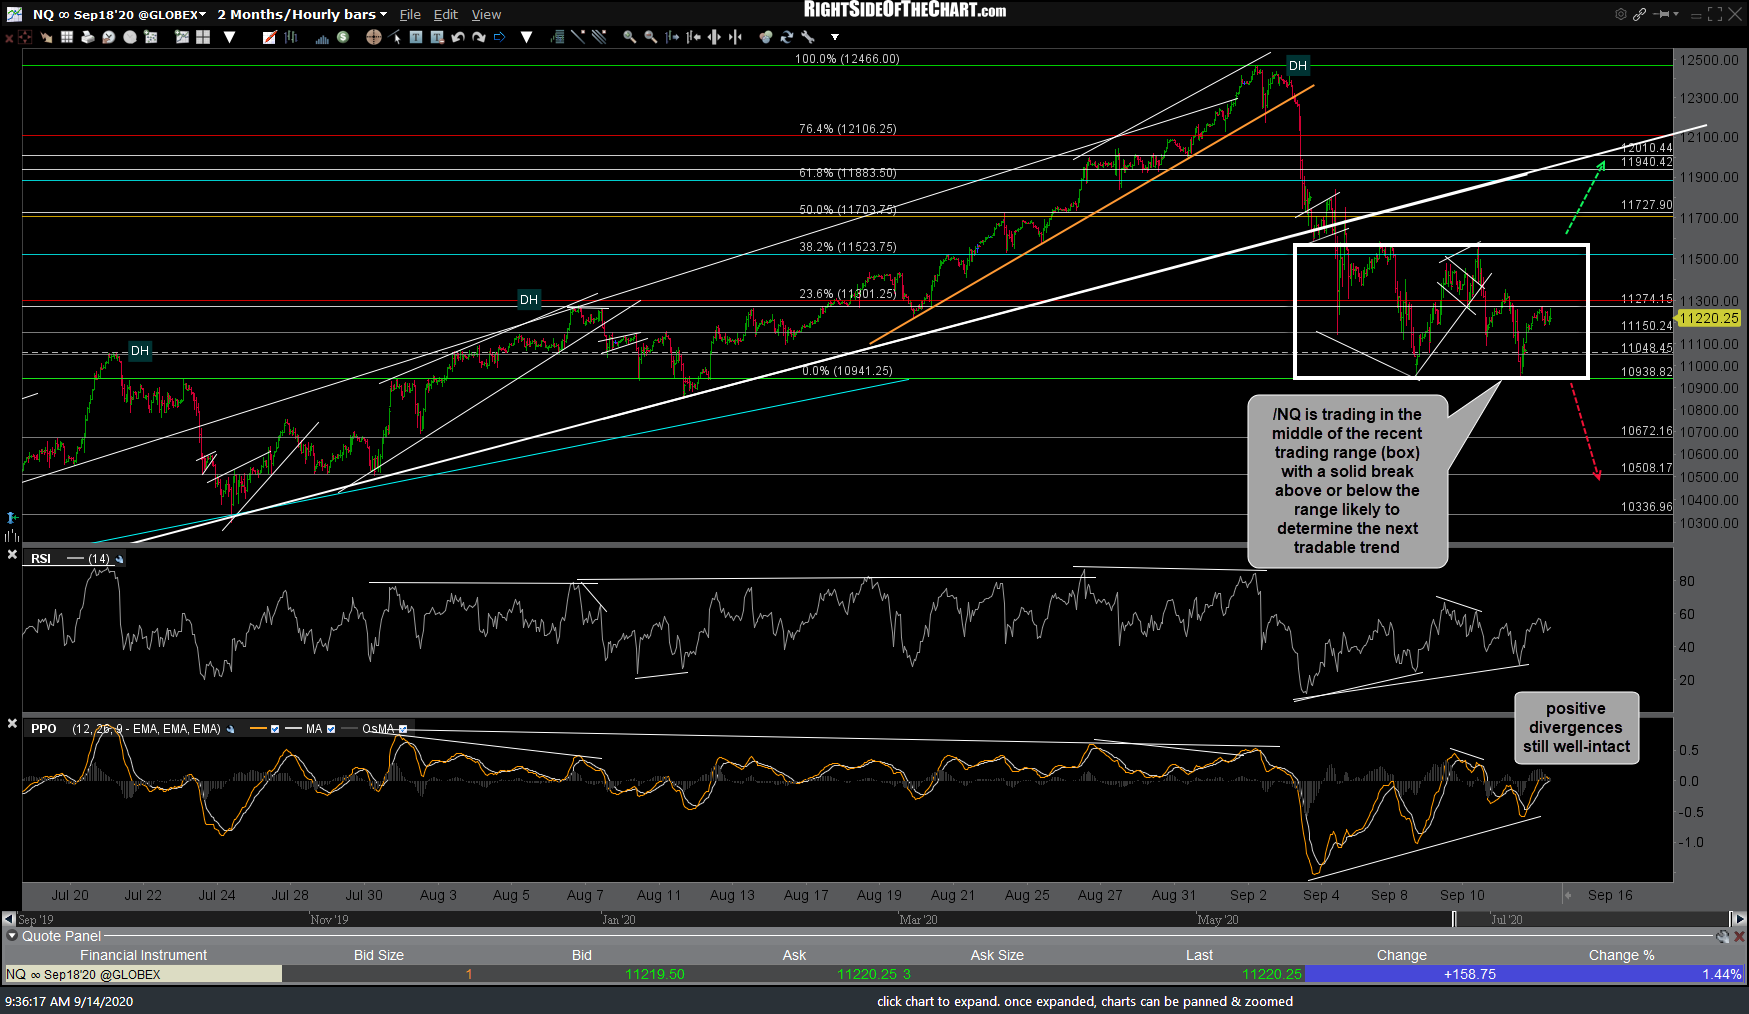
NQ 60m Sept 14th
As of now, the positive (bullish) divergences remain solidly intact with the Nasdaq 100 trading comfortably above the recent lows & today’s breakout titling the near-term outlook back followed by the intersecting 292ish price resistance/backtest of the primary uptrend line/61.8% Fib retracement level, would come into play. At this point, based on the bullish technical posture of the 60-minute charts coupled with today’s impulsive breakout above the bullish falling wedge pattern, any reversal & break below the recent lows would be very bearish, IMO, most likely opening the door to a very swift drop down to the potential T5 zone on QQQ (252-254ish). Today should be interesting as the onus is on the bullish to capitalize on this breakout while a failure to do so would speak to the current supply/demand dynamics of the market & particularly, the tech-heavy $NDX.