
Here’s a quick look at QQQ on various time frames starting with the 15-minute chart. Today saw the Q’s open with a pop, only to see that post-opening pop immediately faded with another failure at the R1 resistance level followed by impulsive selling into the close today with QQQ closing down 1.16% in an abbreviated trading session.

QQQ 15-min July 3rd
Moving out to the 60-minute time frame, QQQ failed at resistance with an impulsive reversal just as it looked like a decent rally was getting underway following the recent bullish falling wedge breakout & successful backtest. Should QQQ continue lower when trading resumes later this week, that will help firm up my bull trap scenario. As I often say, fewer things are more bearish than a failed bullish breakout. Also note that the PPO signal line (9-ema) is still below zero, keeping that trend indicator on a sell signal for now.

QQQ 60-min July 3rd
Last but certainly not least, should the large negative divergences that were put in place at the most recent high on the daily chart play out as expected, we could very well be looking at another 12%+ downside in the Nasdaq 100.
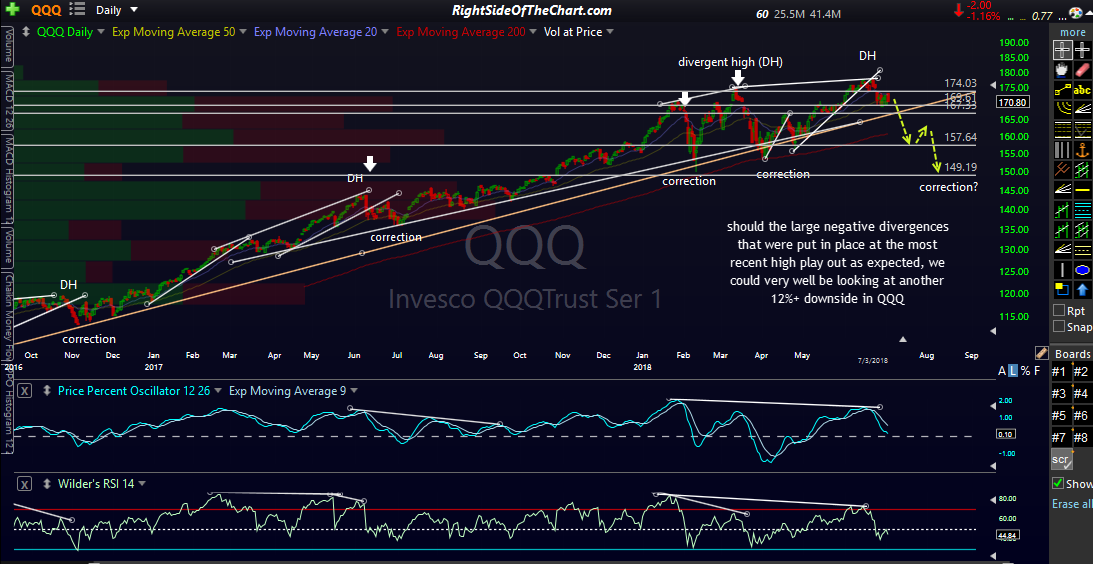
QQQ daily July 3rd
Just a reminder that the US equity markets will be closed tomorrow in observance of Independence Day. Wishing all here in the U.S. a safe & happy holiday and best wishes to everyone else!
-RP