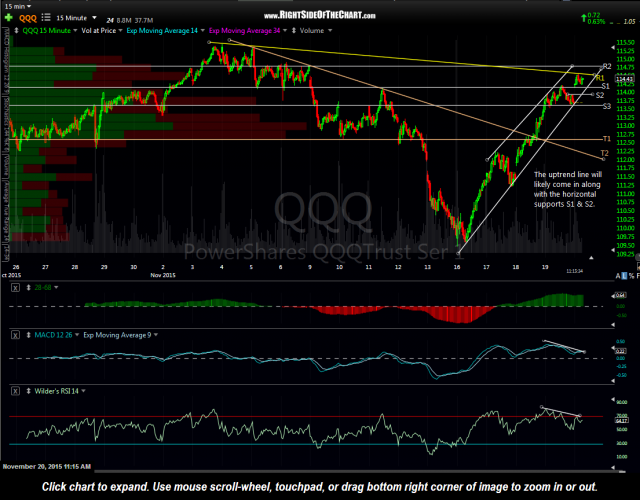
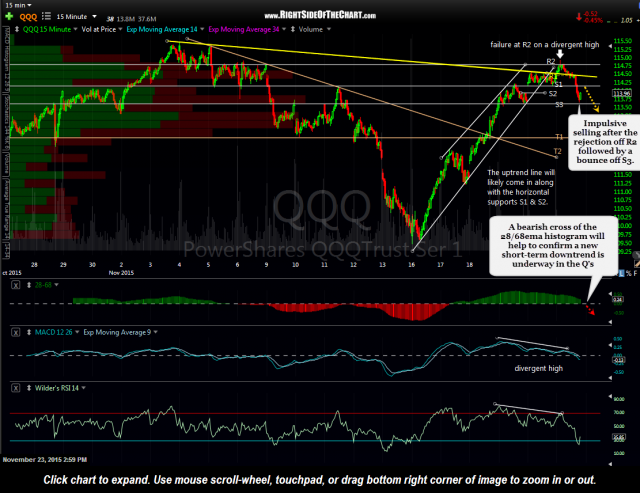
Despite the low-volume pre-holiday trading session, the Q’s couldn’t have traded off the technicals any better so far today. The first chart below is the 15-minute chart of QQQ posted on late Friday morning along with today’s updated chart. Since Friday’s chart was posted, the Q’s when on to bounce up against the yellow downtrend line (R1, or first resistance), until finally taking out that level today, undoubtedly viewed as bullish to the many eyes that were watching that level. However, QQQ had the aforementioned key horizontal resistance level, R2 around 114.80, just overhead where the Q’s were rejected, failing to print a 15-minute candlestick close on the attempt to take that level out.
- QQQ 15 minute Nov 20th
- QQQ 15 minute Nov 23rd
From there, the Nasdaq 100 fell back very sharply on high-volume (relatively high volume compared to volume earlier in the day) which is typical with bull-traps/false breakouts, such as the break above that yellow downtrend line earlier today. That is one reason that I don’t take breakouts above downtrend lines if there is decent horizontal resistance just overhead as such breakouts have a substantially increased chance of failure.
The sharp drop in the QQQ today stopped cold at the S3 (third support level) with the Q’s continuing higher since. S1, which is now resistance (114.15 area) is likely to contain this very near-term oversold bounce but R2 (114.80) remains the key level that needs to contain any rallies in order to keep my near-term bearish, post-OpEx-ramp selloff outlook intact. Once again I must reiterate that the low-volume abbreviated Thanksgiving trading week is often plagued with false breakouts and other whipsaw signals so best to be very selective on establishing any new positions or just avoid trading all together (which is what I usually do).


