
QQQ made perfect tag & reversal off my bounce target (preferred scenario) that posted yesterday at the tail-end of last yesterday’s post-market trading session (white candles). While my primary scenario still has another leg down to the next target around 361 although I’m split about on whether we get one more leg up before then (and suspect at least a relatively small bounce from where QQQ is trading in pre-market right now) but if so, the most likely high-end of any bounce from here would be around that 375.40 resistance level, which is only 1% above the target that QQQ hit in yesterday’s AH session. Previous (yesterday a.m.) & today’s updated 60-minute charts below.
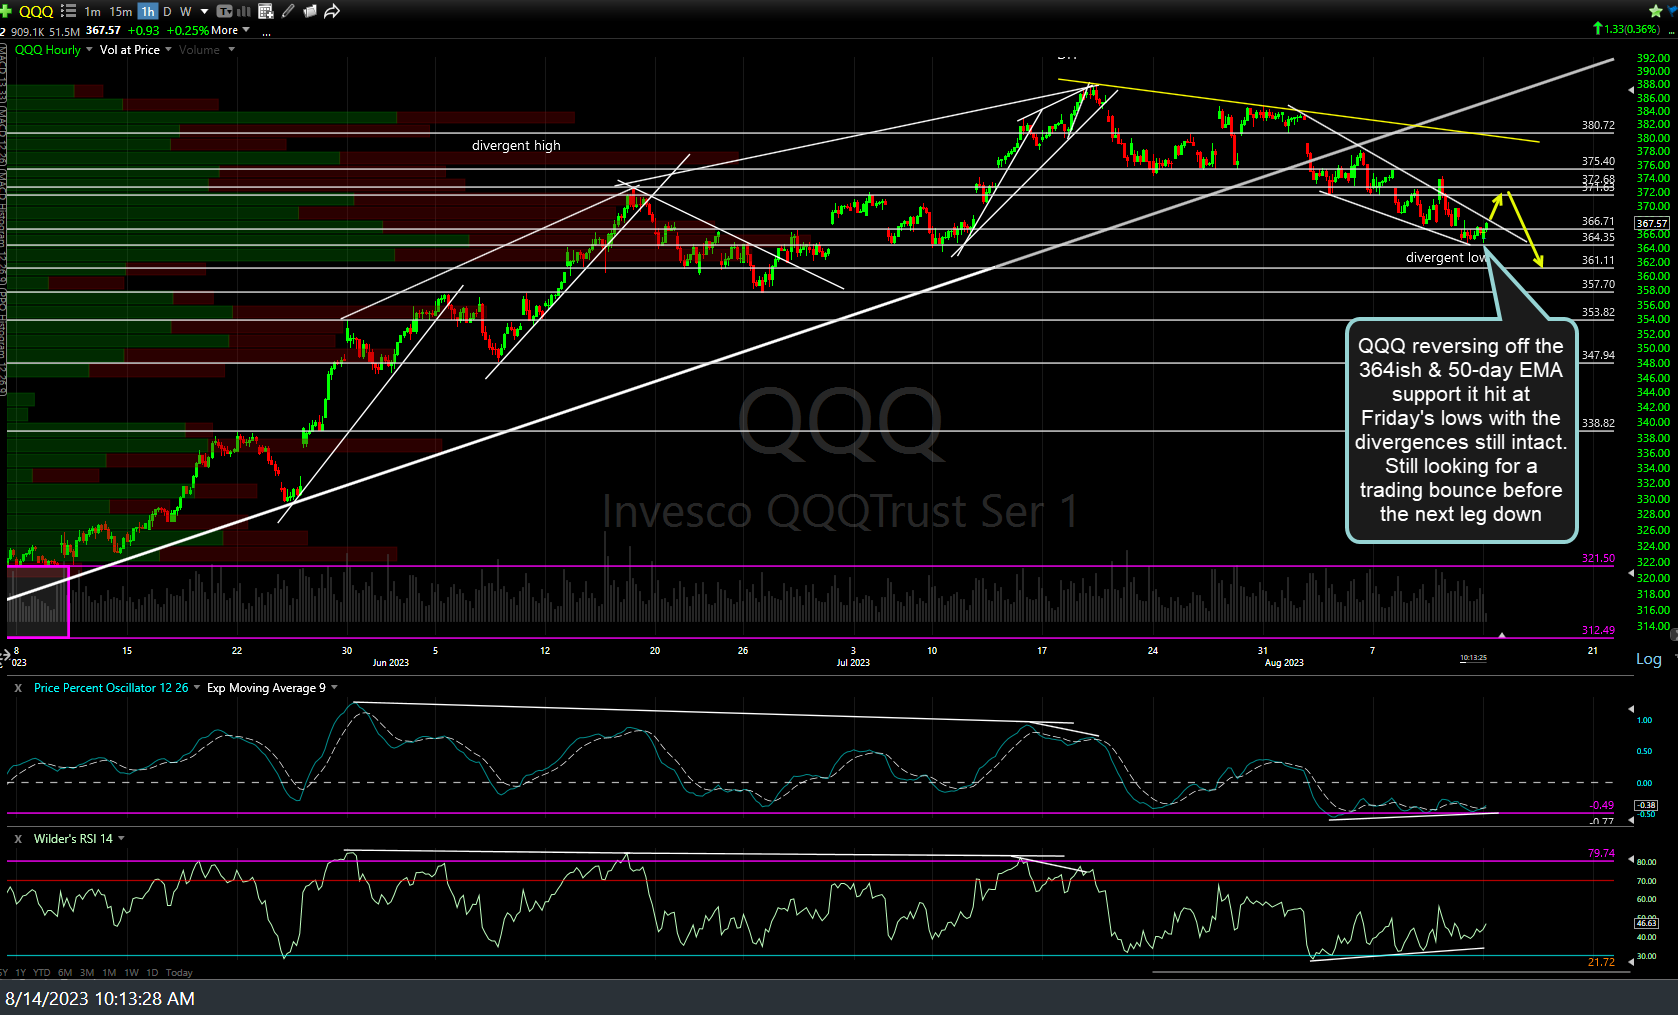
QQQ 60m Aug 14th
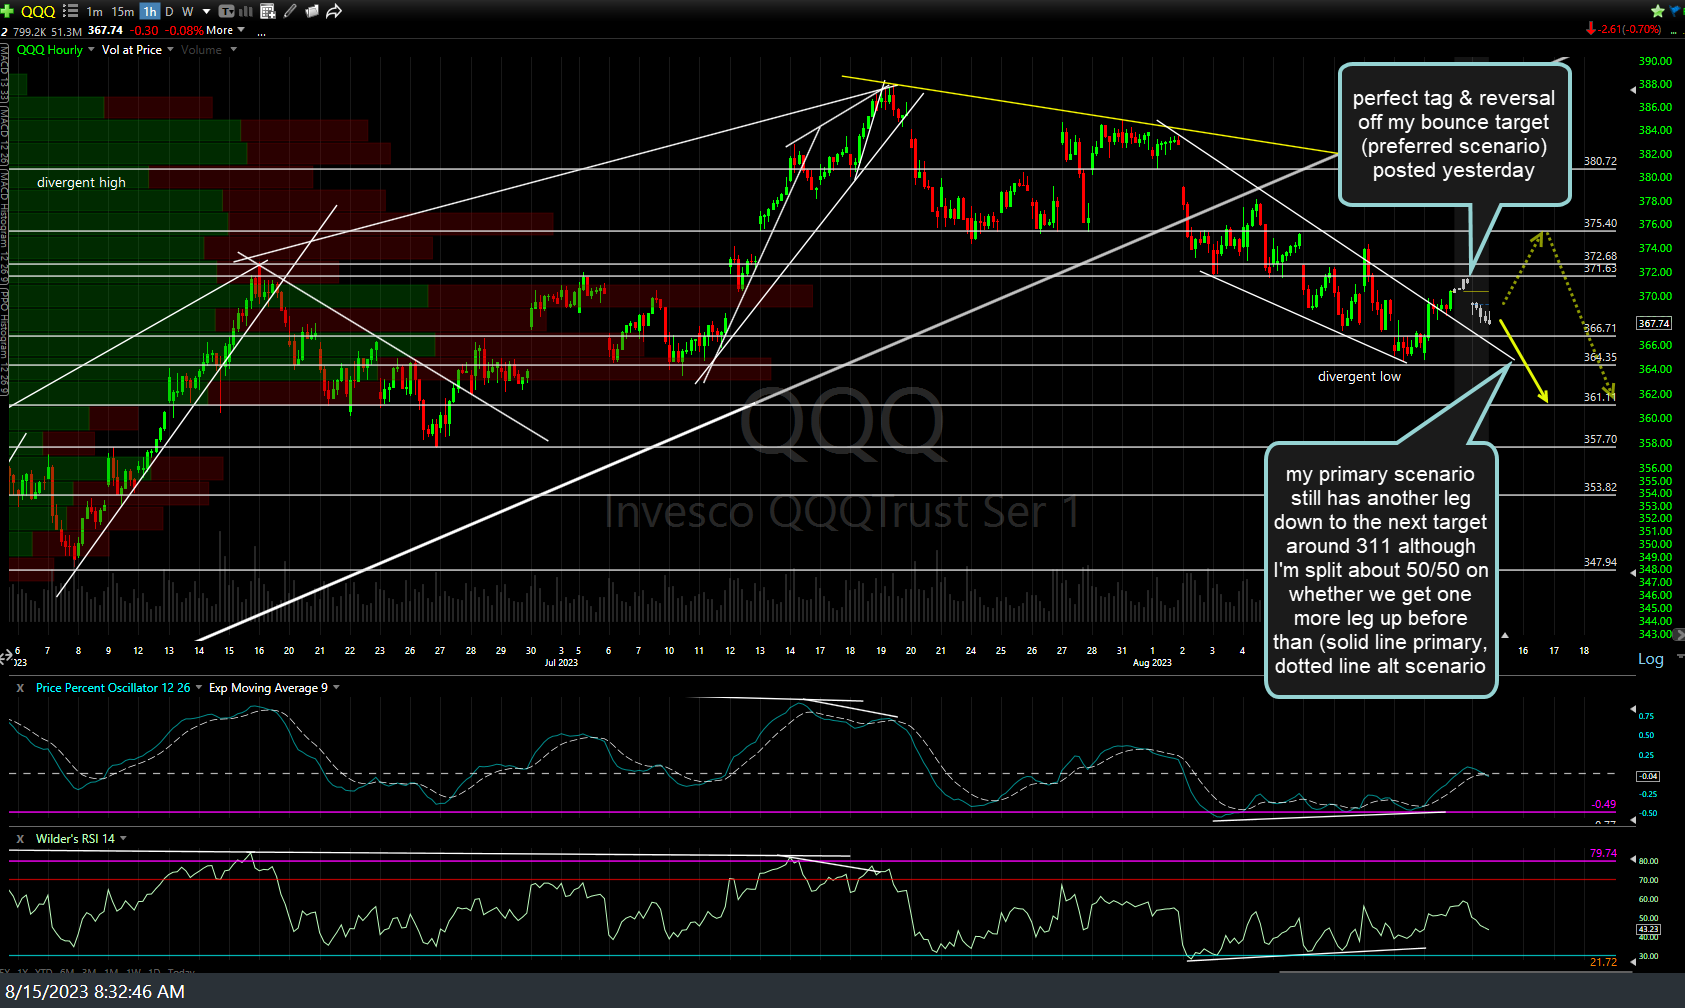
QQQ 60m Aug 15th
Bottom line: Nothing has changed on my intermediate-term bearish outlook with more downside in the coming weeks to months, with an over-weighting on the tech-heavy Nasdaq 100 and/or tech sectors (XLK, SOXX, FAAMG tracking ETFs, etc..). Typical swing & trend traders might opt to remain focused on the longer-term (daily & weekly) charts while active traders might continue to find profitable short-term trading opportunities utilizing the shorter-term intraday time frames (e.g. 5-60 minute charts), especially with volatility finally picking up recently.