
I’ve added this blue uptrend line just below the previously posted white TL which has an equal number of reactions as the upper-TL & defines the lower-end of the rising wedge pattern as well as aligning with the 305.41 support. Once again, this pullback to support provides an objective entry or re-entry on any $NDX-related longs. 60-minute chart below.
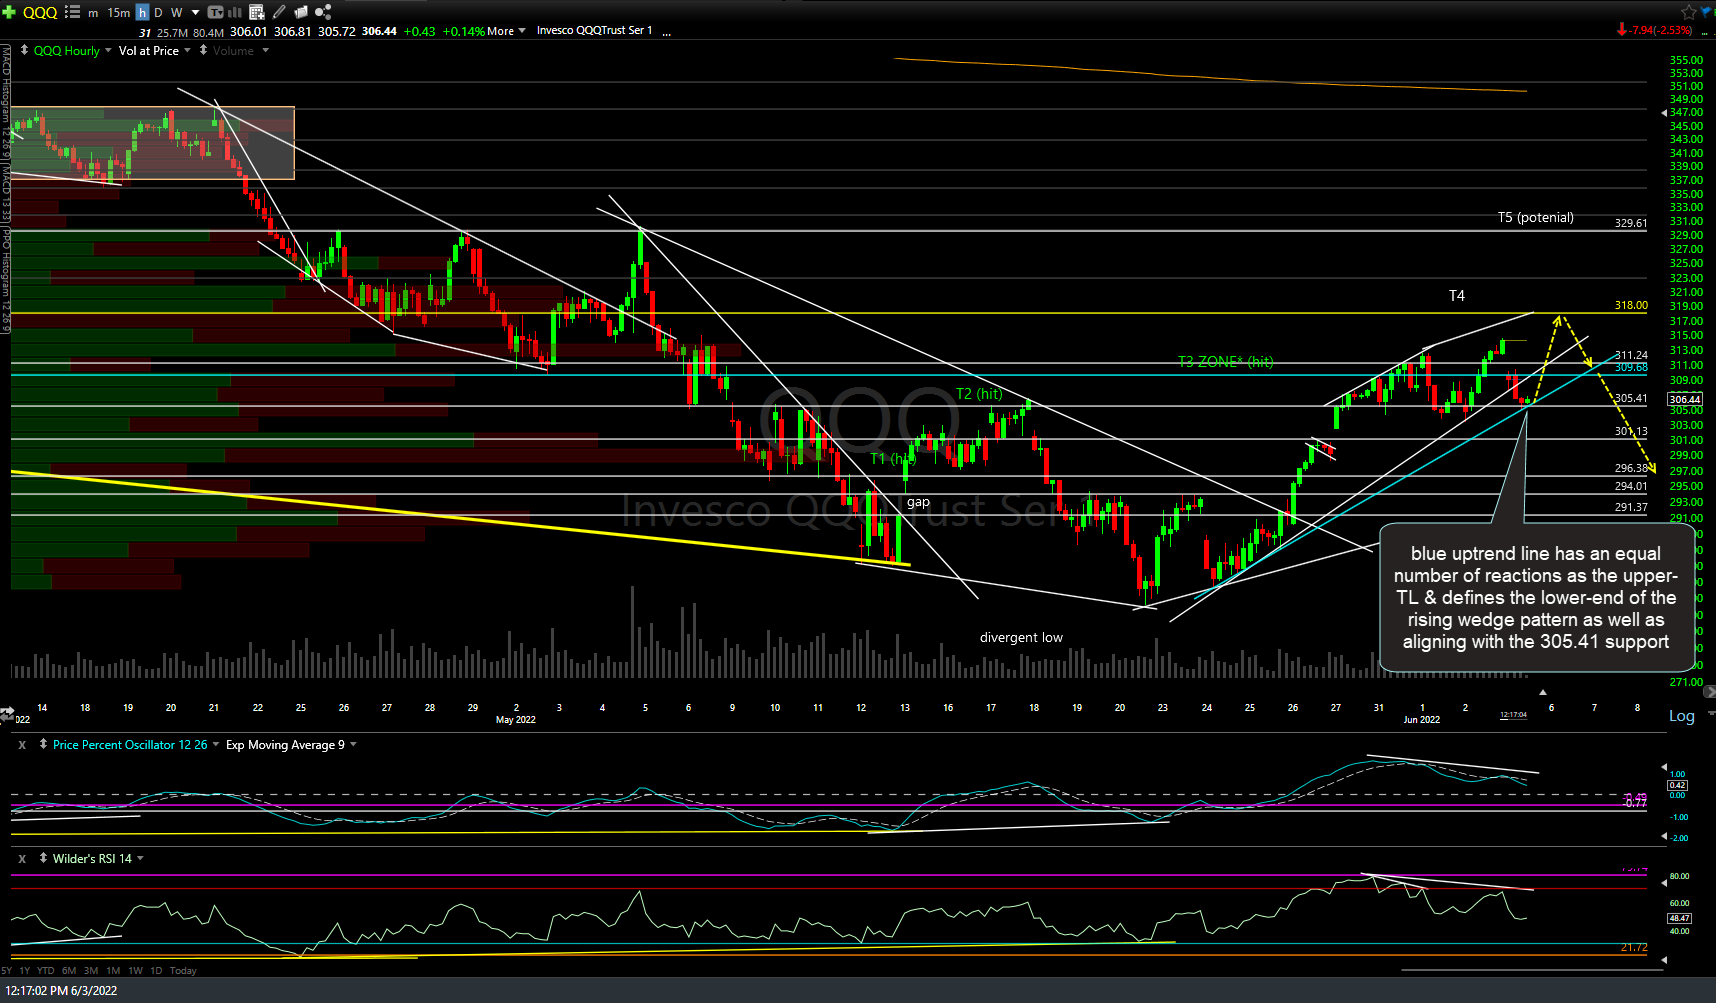
QQQ 60m 2 June 3rd
What prompted me to add that alternative blue uptrend line to the 60-minute chart is the fact that I had the same uptrend line on my 5-minute chart of QQQ with gap support just below, should this TL fail to contain the pullback. Arrows show a likely scenario if the trendline (or the gap support just below) contains the pullback with another leg up in the coming days+ as I still favor at this time.
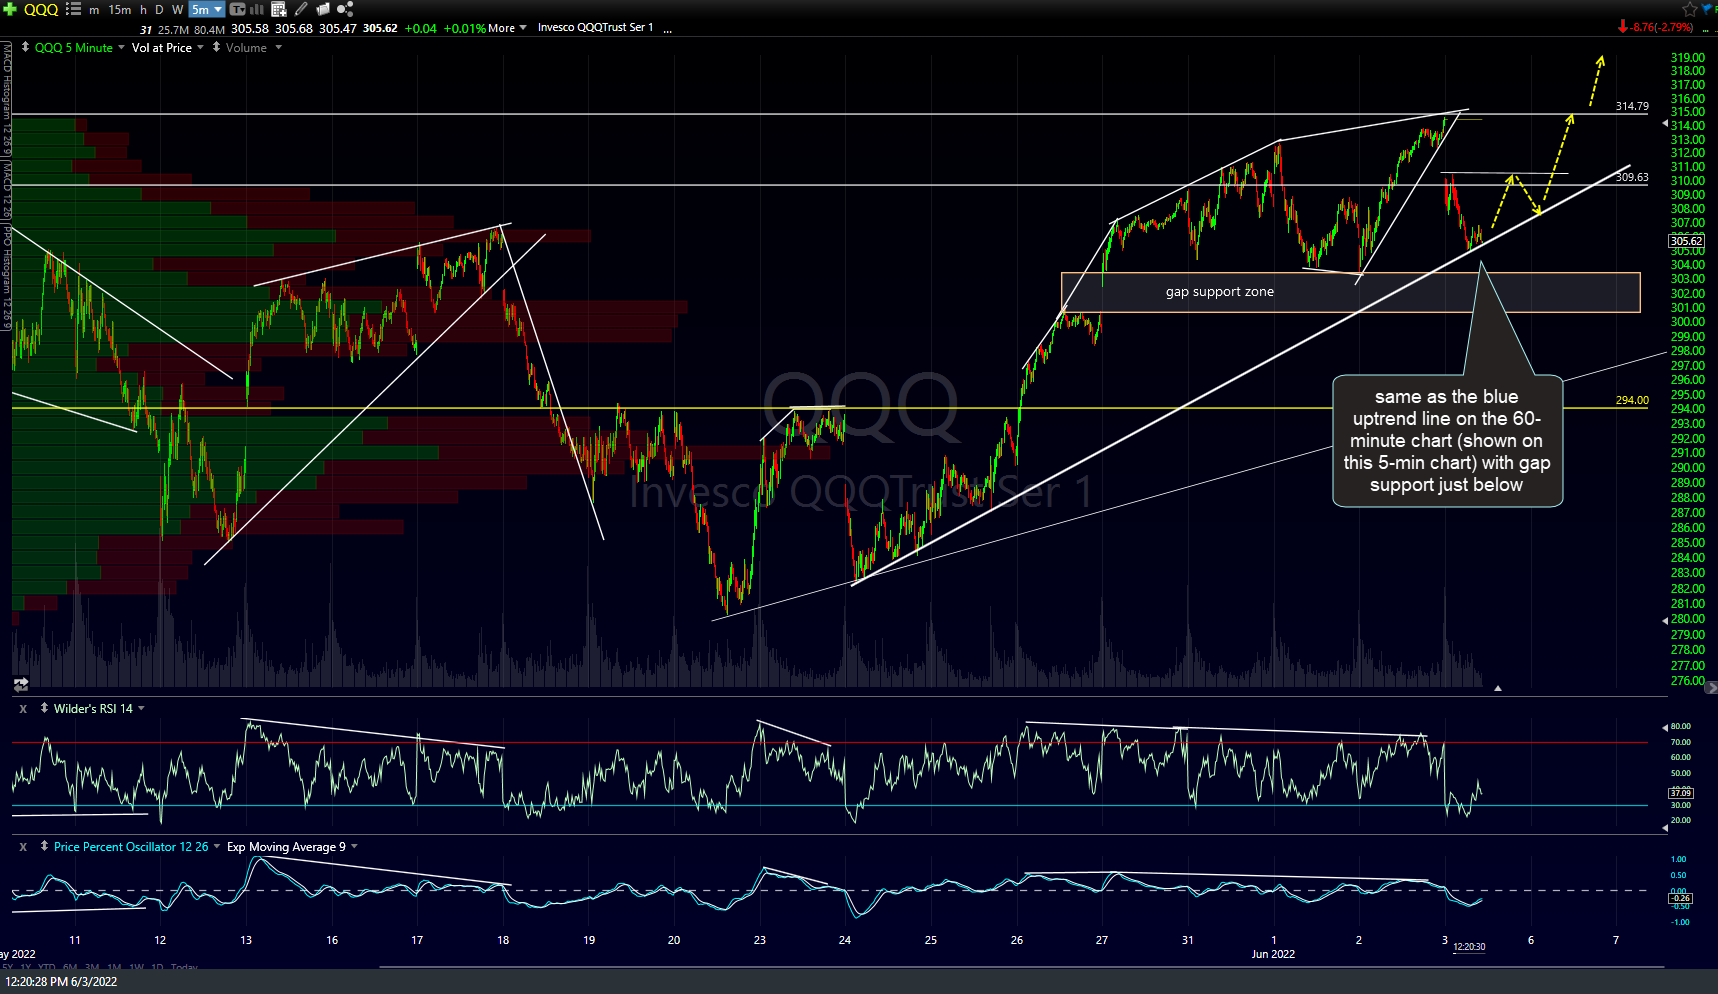
QQQ 5m June 3rd
Of course, if & as each price target on QQQ is hit (and we already hit T3 of my 4 current official targets with T5 still only a potential, not current target), the chances that the counter-trend rally has run its full course increase substantially. As such, the R/R is far from as favorable as it was when the major indexes & key stocks were trading at their key price targets on the daily & weekly charts 2-3 weeks ago or when QQQ broke out above the key 294.00 resistance level.
With that being said, there are still plenty of trading opps, especially for active traders that can game pullbacks off resistance & bounces off support while less-active swing & trend traders holding out for additional upside should realize that the “easy” money has already been made with the sharp & mostly uni-directional move off the recent divergent lows & while I still favor more upside in the coming days to weeks, it will likely come in a more back & forth (zig-zagging) fashion.