
QQQ has bounced up to the downtrend line (resistance) in the pre-market session, offering an objective short entry or add-on to an existing position. 60-minute chart below.

QQQ 60m Oct 14th
At the same time, FB (Facebook Inc). has taken out the 60-minute downtrend line in pre-market trading with the breakout to be confirmed if it sticks during the regular session. Also, note that a rejection off the downtrend line in QQQ would likely foil this breakout. 60-minute chart below.
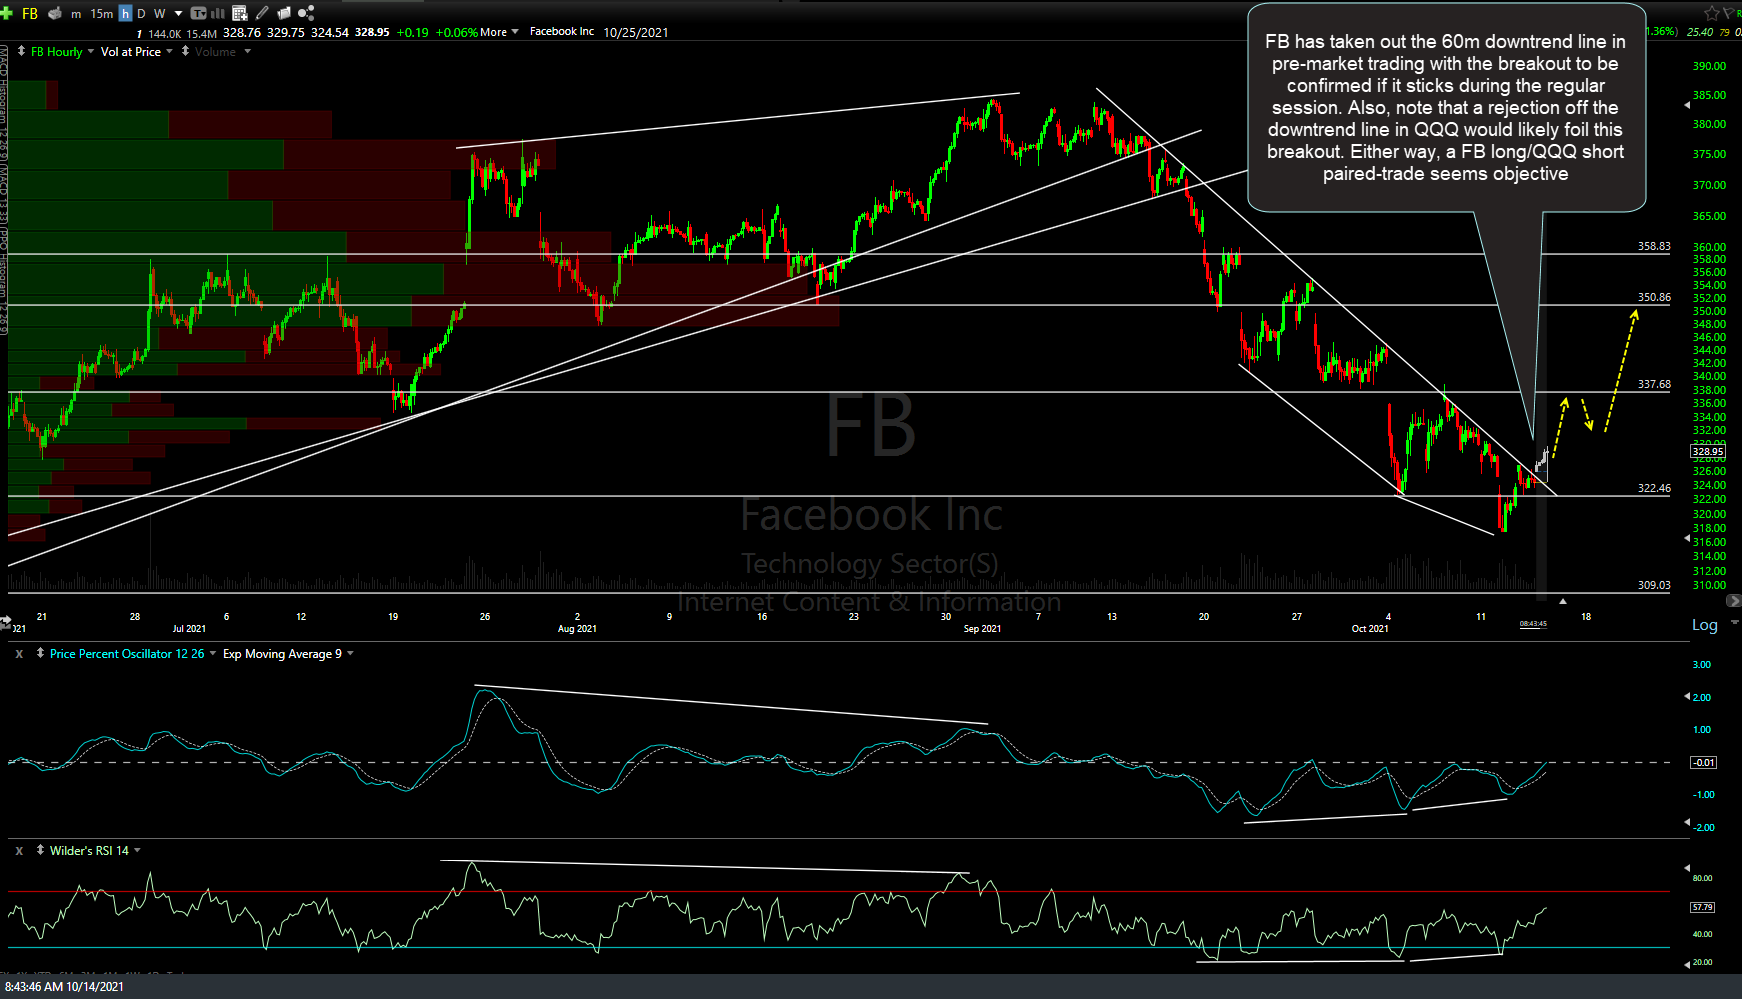
FB 60m Oct 14th
Additionally, FB made a perfect kiss & successful (so far) test of the 200-day SMA (blue line) yesterday. As the white arrows on the daily chart below highlight, the 200-day SMA has done an excellent job of acting as support during pullbacks in recent years with the sole break below the 200-day SMA back in late February of 2020 followed by a 28% plunge.
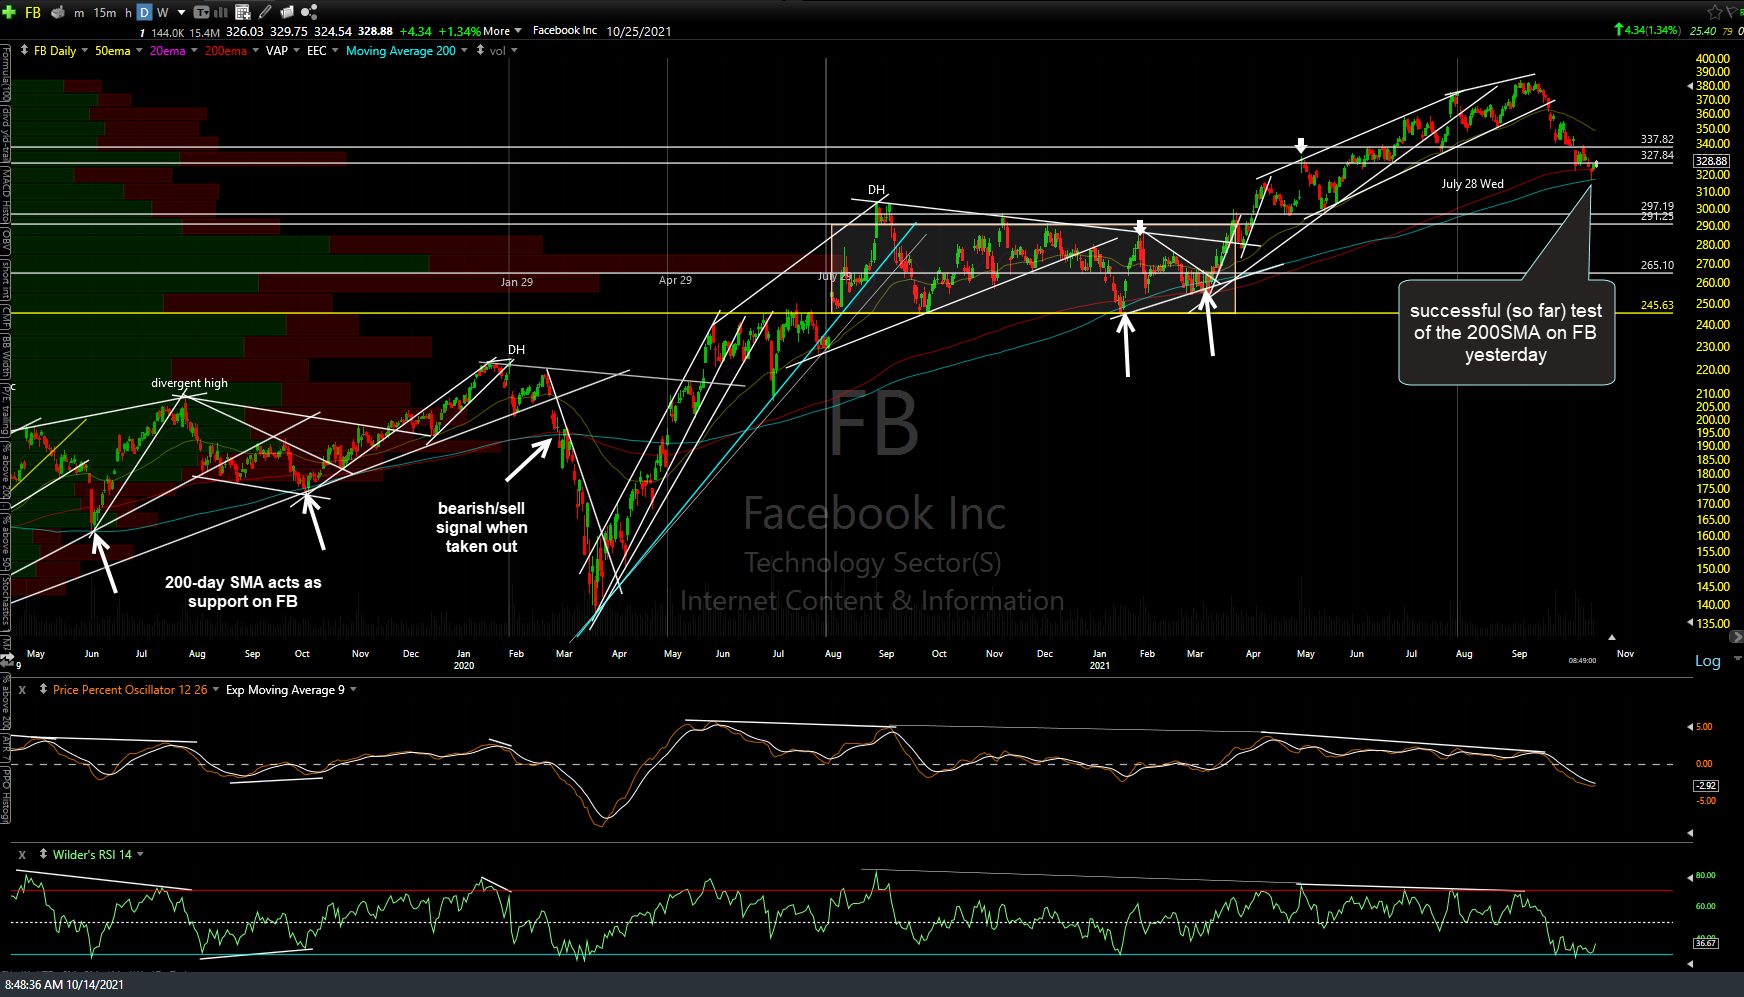
FB daily Oct 14th
With FB being one of the top-weighted components of QQQ, a long entry on FB with the Q’s trading at resistance might sound a bit paradoxical but as of now, a FB long/QQQ short paired-trade certainly seems objective & relatively low-risk due to the hedging aspect. Of course, those bullish on the stock market & as well as FB could go long either although it would be best to wait for a solid break above the downtrend line on QQQ, especially during the regular trading session.
Potential targets on FB are the marked horizontal levels on the 60-minute chart although should QQQ fail to solidly take out the downtrend line, the odds of FB rallying to anything more than the first target (337.68ish) would be unlikely.