
QQQ (Nasdaq 100 ETF) is approaching the maximum potential bounce target posted on Oct 25th (first chart below) from pre-META/AMZN/AAPL earnings, where a reaction is likely. Arrow breaks on the updated (2nd) 60-minute chart below denote potential near-term pullback targets.
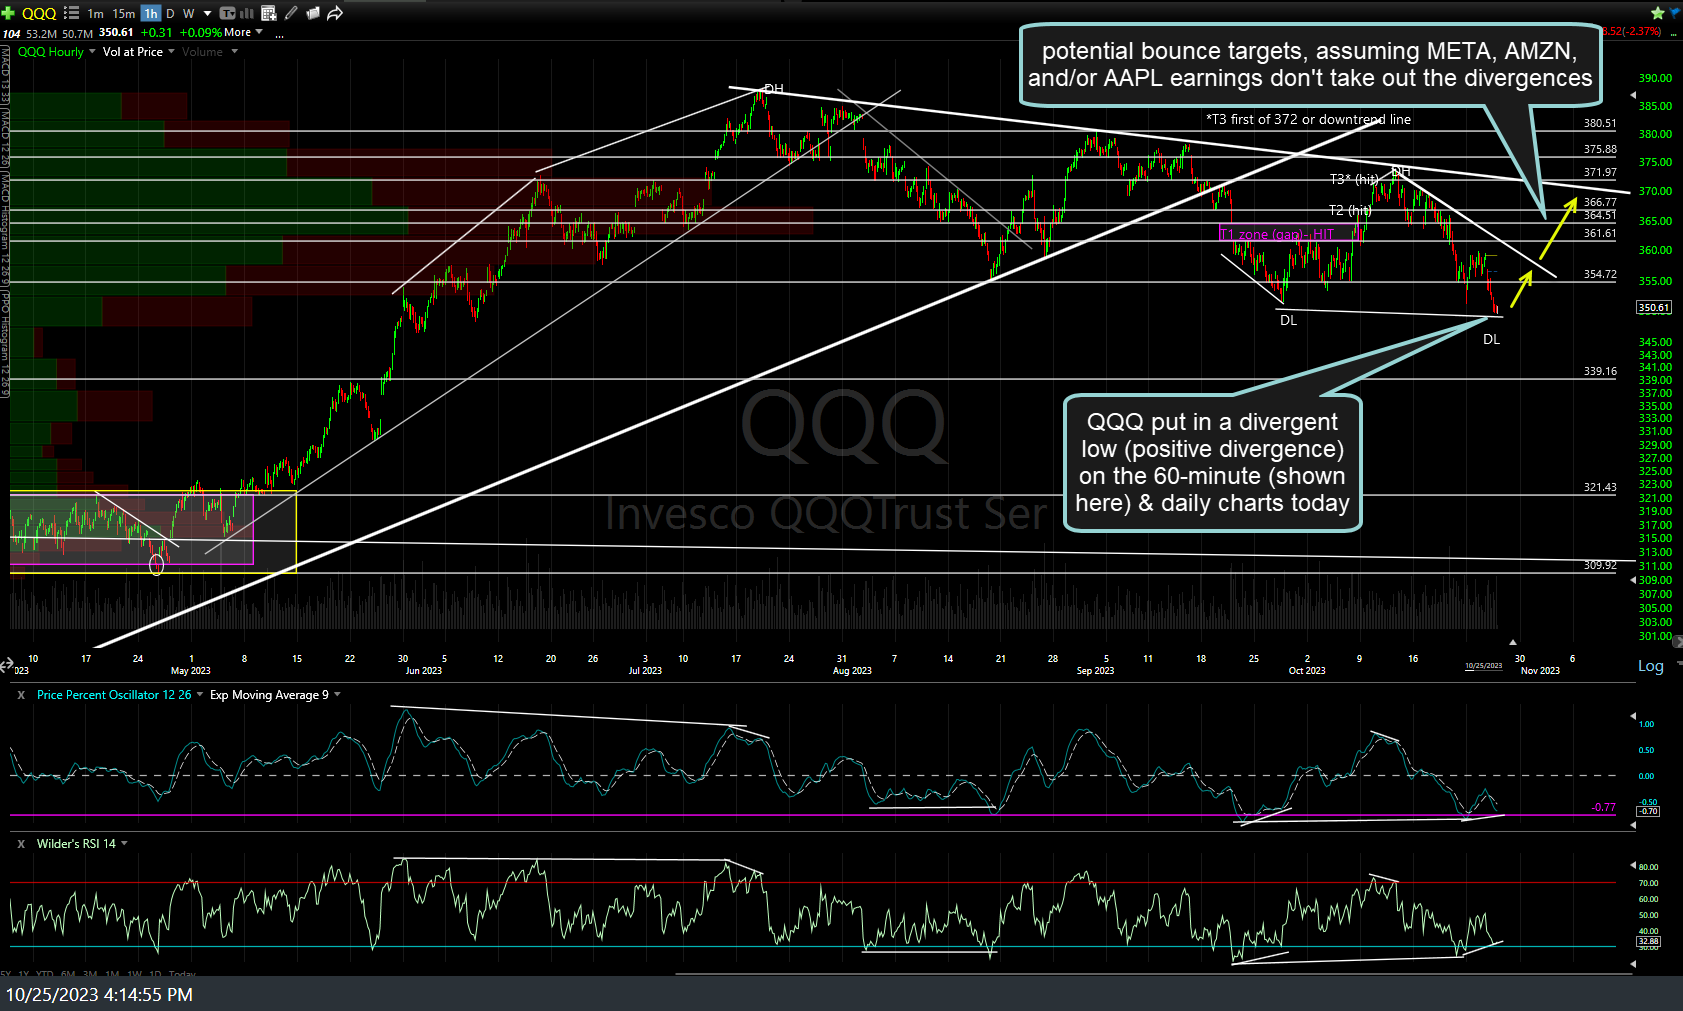
QQQ 60m Oct 25th
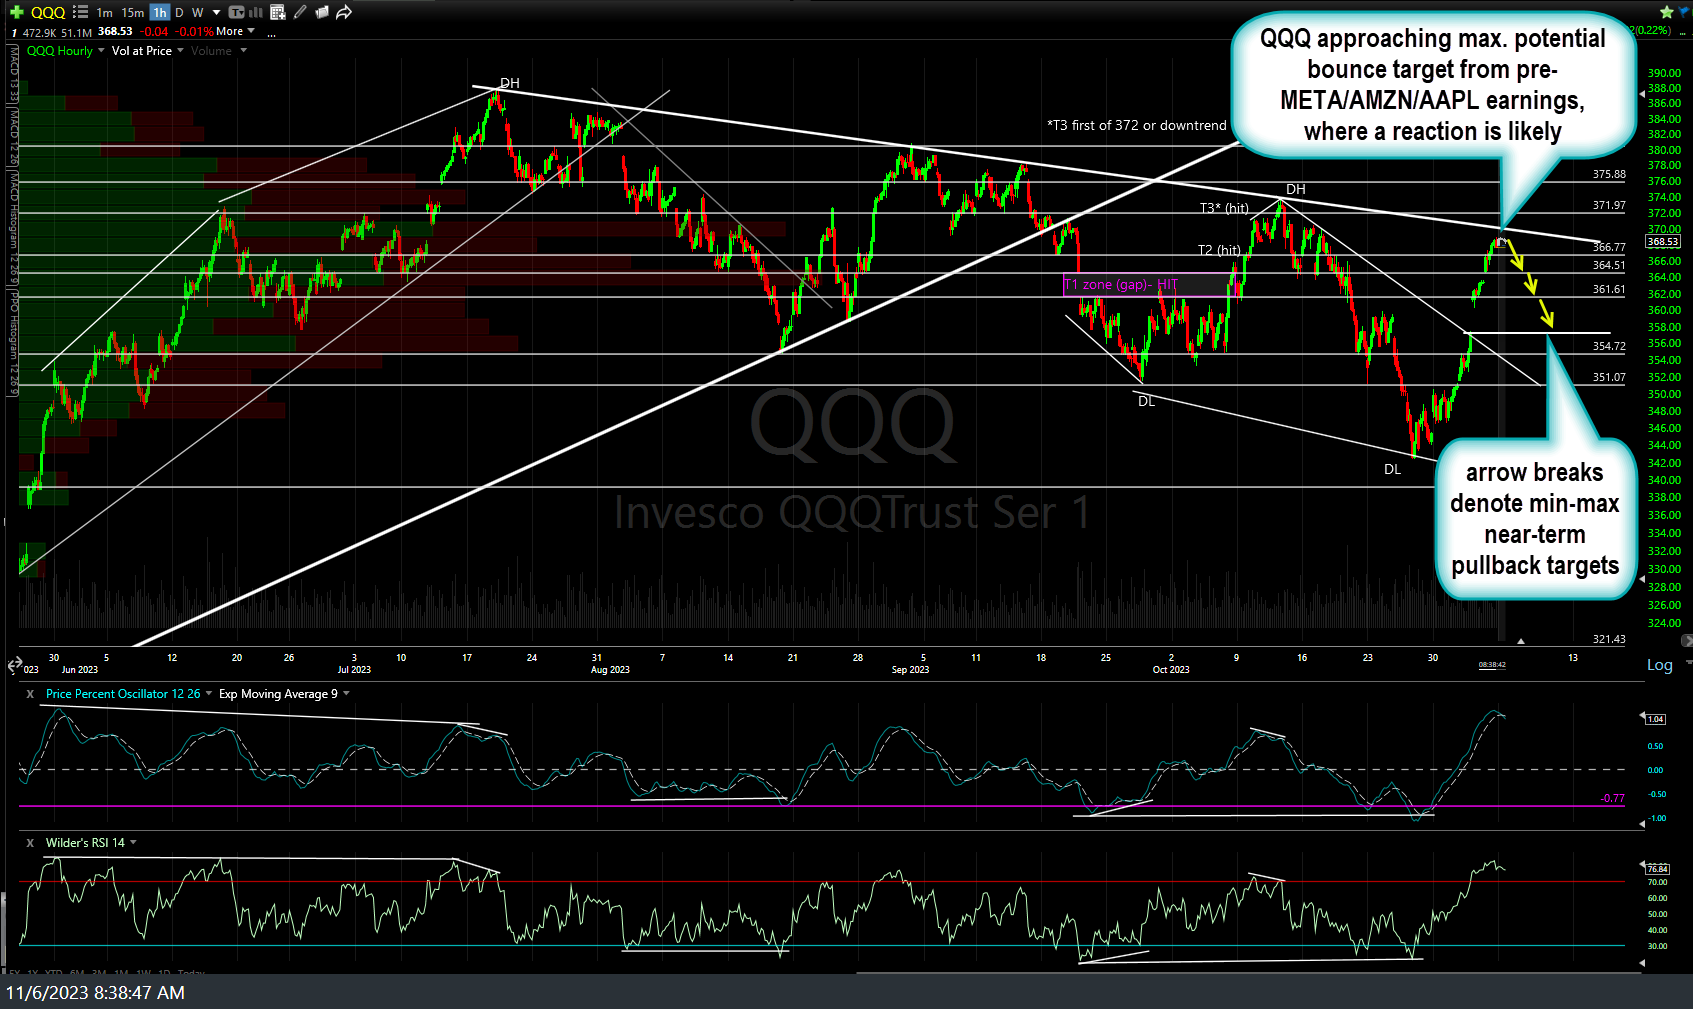
QQQ 60m Nov 6th
It’s all about Treasury yields (interest rates) right now so whether or not we get a half-decent or better tradable pullback here …or… the Nasdaq 100 goes on to make a solid breakout & rally above the key downtrend line off the mid-July highs will most likely depend on if & how much (and even WHEN) yields continue to fall from here. As of now, IEF (7-10 yr Treasury bond ETF) is at downtrend line resistance (60m & daily charts) with the TLT (20-30 yr Treasury bond ETF) hitting & reversing off my second price target (T2) on Friday & currently backfilling Friday’s gap in the pre-market session as I type, although I remain intermediate-term bullish on Treasuries for now, still favoring more upside in the coming days to weeks to my next targets on TLT (T3 & T4). Of course, if & when something changes in the technicals and/or my outlook, I will convey my thoughts asap.