
This 60-minute chart of QQQ has just about all the significant technical events and levels/developments which have been highlighted over the past couple of weeks, starting with the divergent high & sell signal triggered back on Sept 3rd which was the catalyst for the nearly 12% correction in the tech-heavy $NDX. After hitting & bouncing off T4, QQQ put went on to trigger a near-term buy signal yesterday’s impulsive breakout (via a gap up) above the 60-minute bullish falling wedge pattern with positive divergences in place on the momentum indicators.
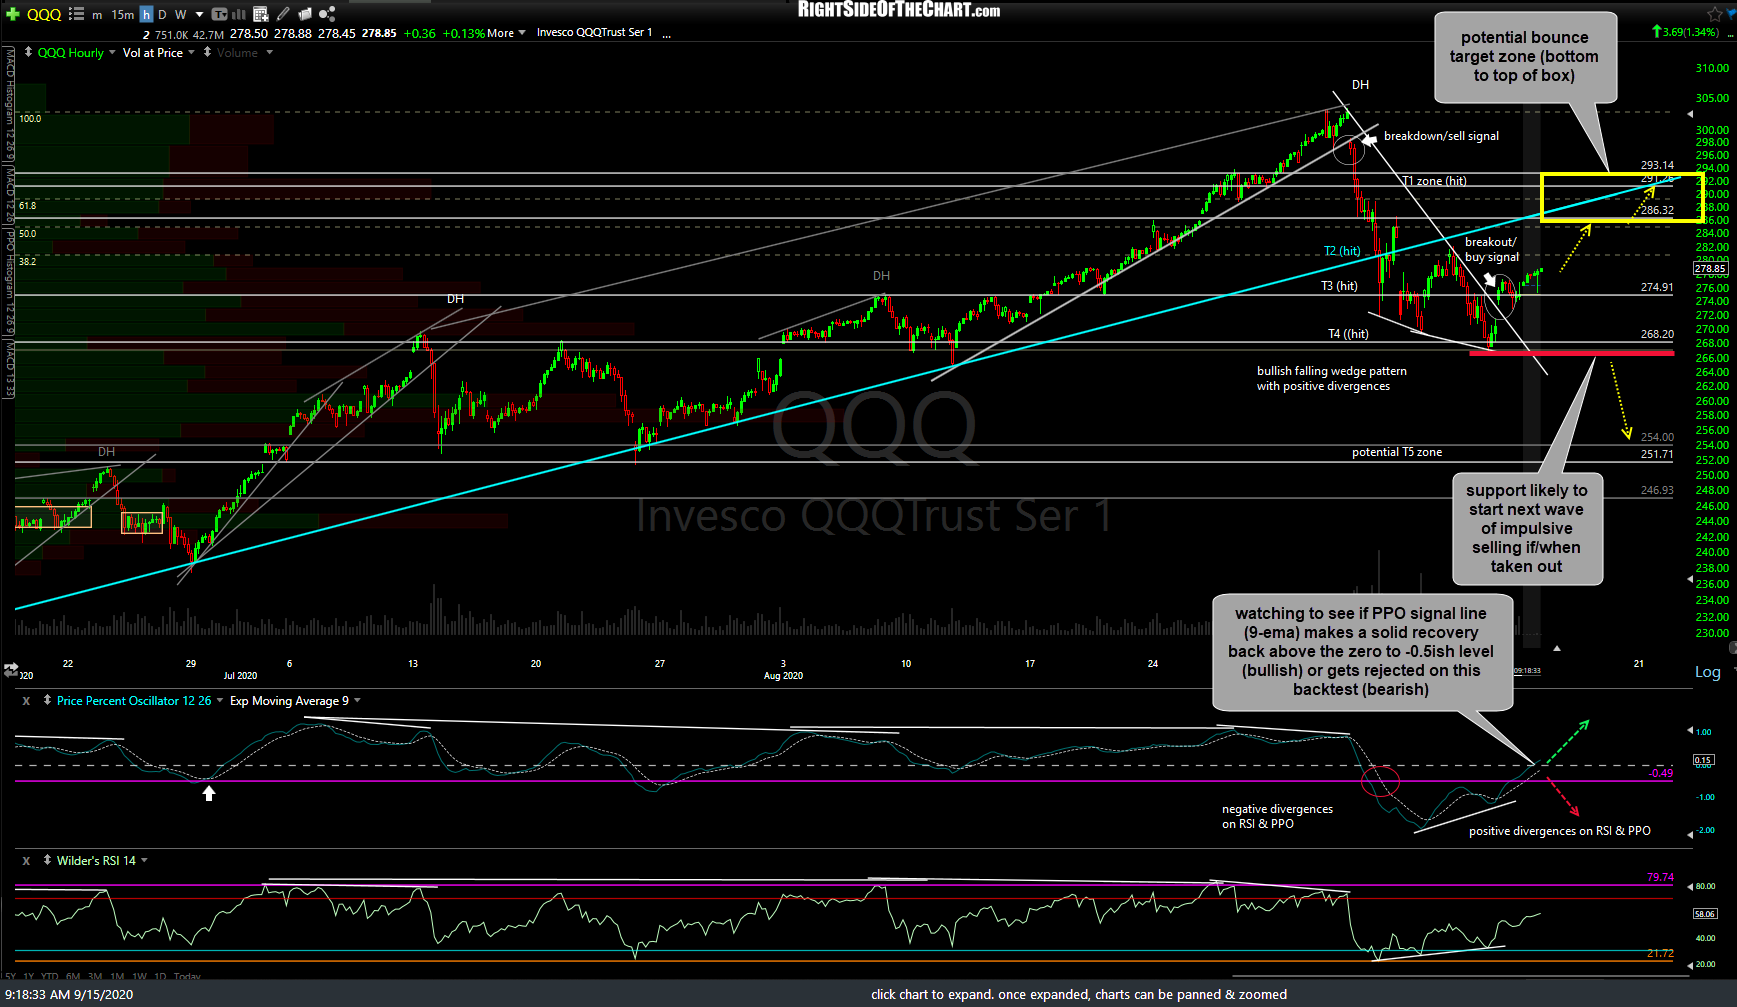
QQQ 60m Sept 15th
While those recent bullish developments increase the odds of the potential bounce targets that were laid out last week (T1 at 286.32 + 50% Fib followed by T2 at the 292ish resistance zone + 61.8% Fib + backtest of the primary uptrend line) being hit, that is far from a foregone conclusion at this time. A couple of things that I’ll be watching for today is how QQQ acts if/when it makes a second test of the 38.2% Fibonacci retracement level after being rejected off the initial test on the bounce into the Sept 10th reaction high. I’m also keeping an eye on the PPO signal line (9-ema/white dashed line) as it backtests the zero line/-0.05ish level. When the PPO signal line is trading above that level, the trend is bullish & bearish when below. Those are some of the developments that I’ll be watching for today. Looking out several days to several weeks, I’ll be watching to see if QQQ can move well beyond the top of my upper-most bounce target range (bullish) or below the recent lows/T4 level (bearish).