
QQQ (Nasdaq 100 Tracking ETF) hit T4 (the fourth price target) shortly after the close yesterday in the after-hours trading session. The first chart below is the QQQ 60-minute chart posted shortly after the open on Sept 2nd when the sell signal was triggered on the minor trendline break. Arrow breaks at the price targets denote levels where a reaction is likely upon the initial tag. So far, we’ve had a tradable reaction at the initial tag of each price target except T1, as the selling was very impulsive immediately following the breakdown (not to mention the first target zone was set slightly below the trendline/breakdown level).
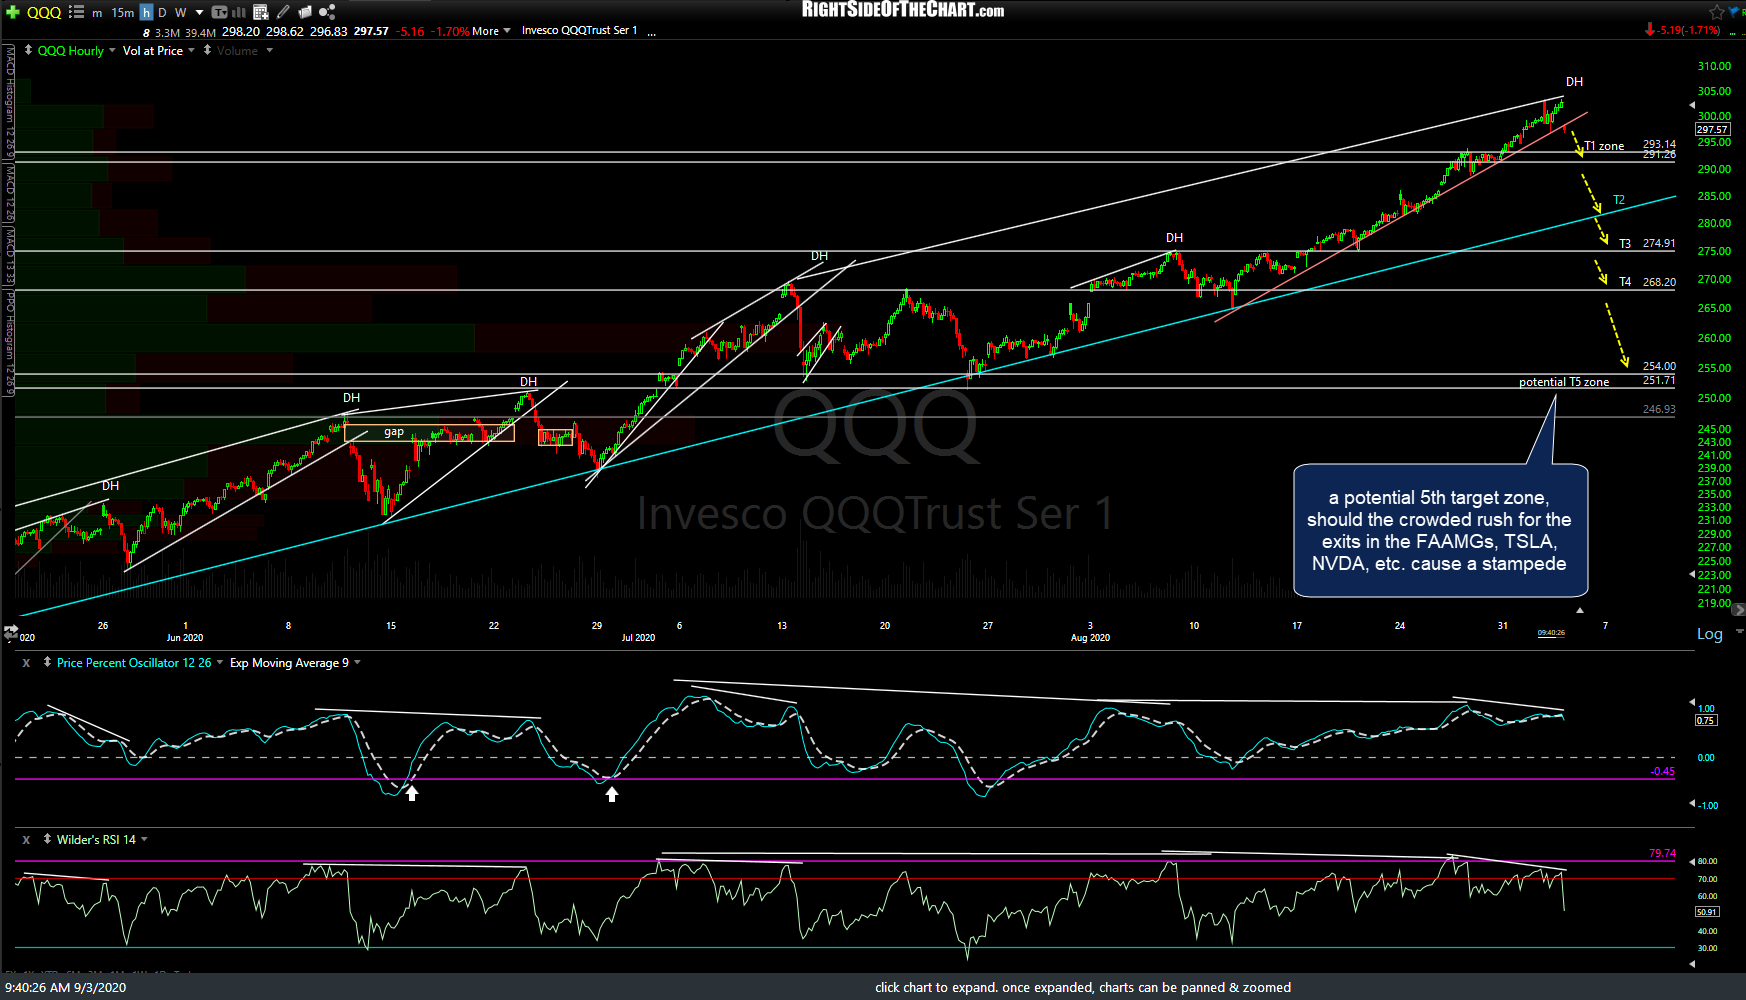
QQQ 60m 2 Sept 3rd
The updated 60-minute chart below shows a potential bounce target as a backtest of the primary (blue) uptrend line although we’ll have to assess any bounce if & as it develops in order to determine when to close out any bounce-long trades and/or start to scale back into short positions.

QQQ 60m Sept 9th
While QQQ only has positive divergence on the RSI 60-minute time frame, the bullish divergences on both the RSI & PPO are still very much intact & confirmed on the 60-minute chart of /NQ (Nasdaq 100 futures), which is a potential catalyst for a tradable bounce, should those divergences pan out for a half-decent counter-trend bounce off the 10939 price target/support which /NQ just kissed & reversed off, as well as the T3 target/support level on QQQ. A potential bounce target zone on /NQ is 11728 up to the 11940-1210ish resistance zone, which would also coincide with a backtest of the primary uptrend line. (Edit: this last sentence was edited to correct the bounce target to the range outlined in the chart below. The original text left out the 11728 resistance as the minium bounce target.)
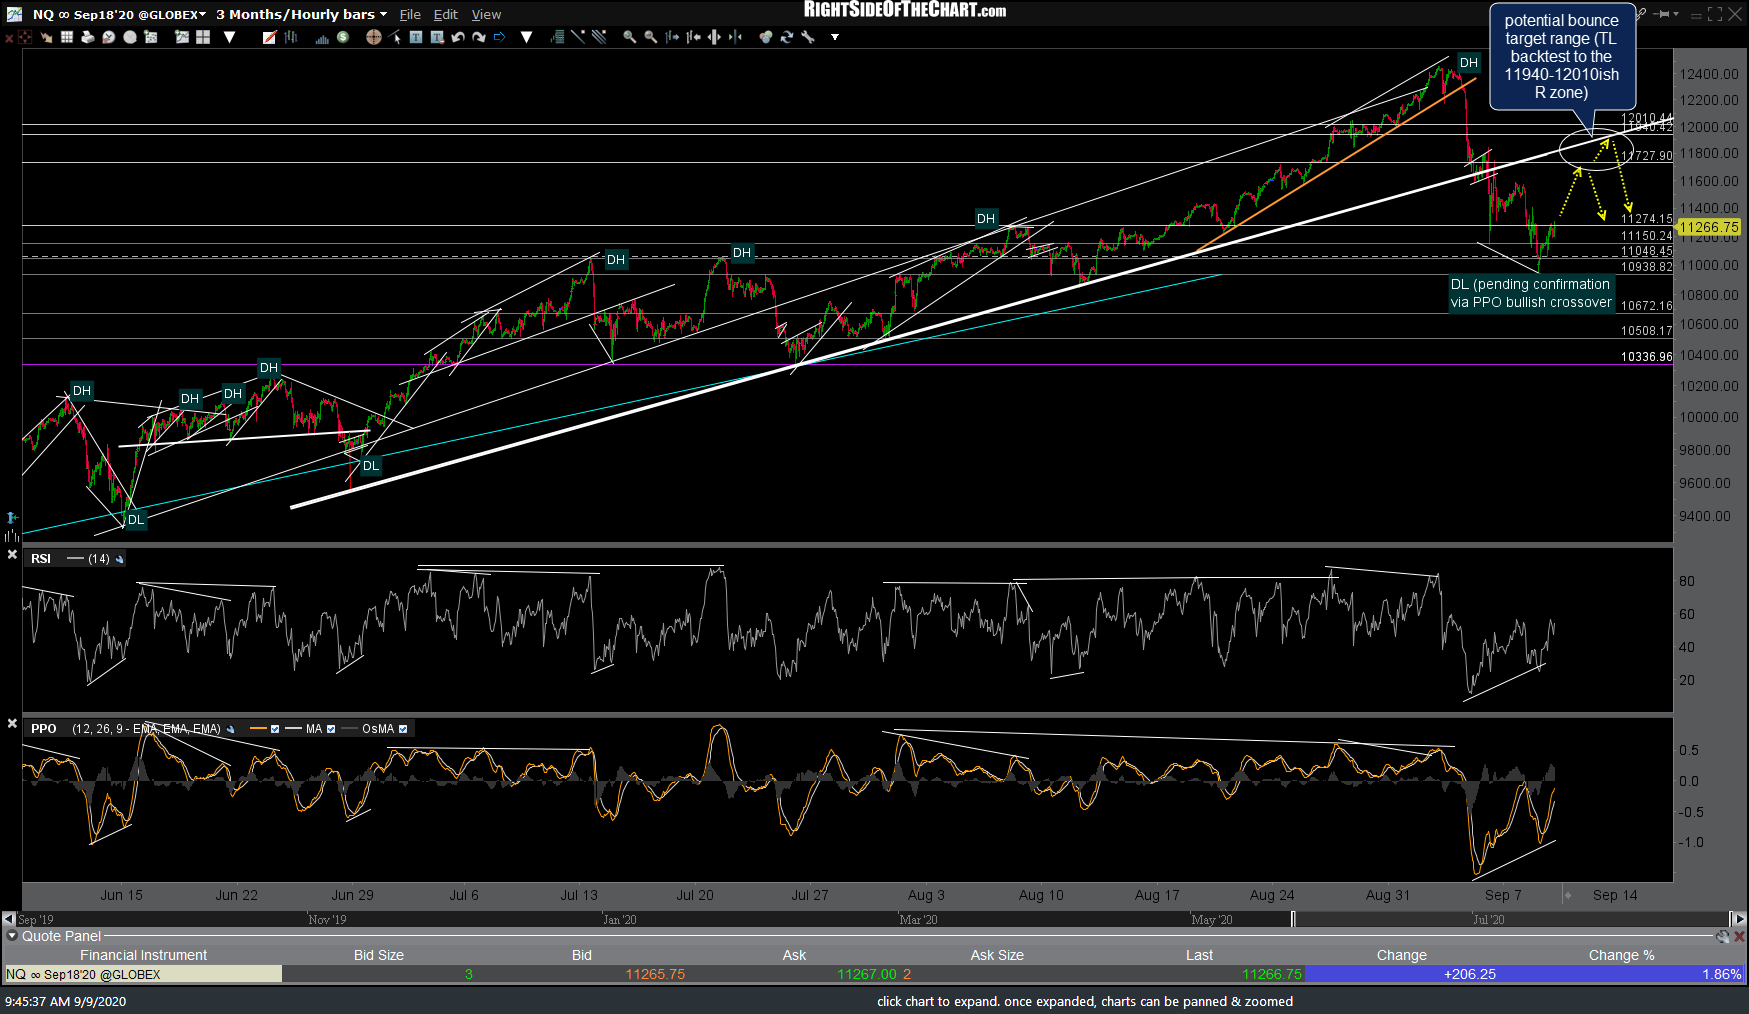
NQ 60m Sept 9th