
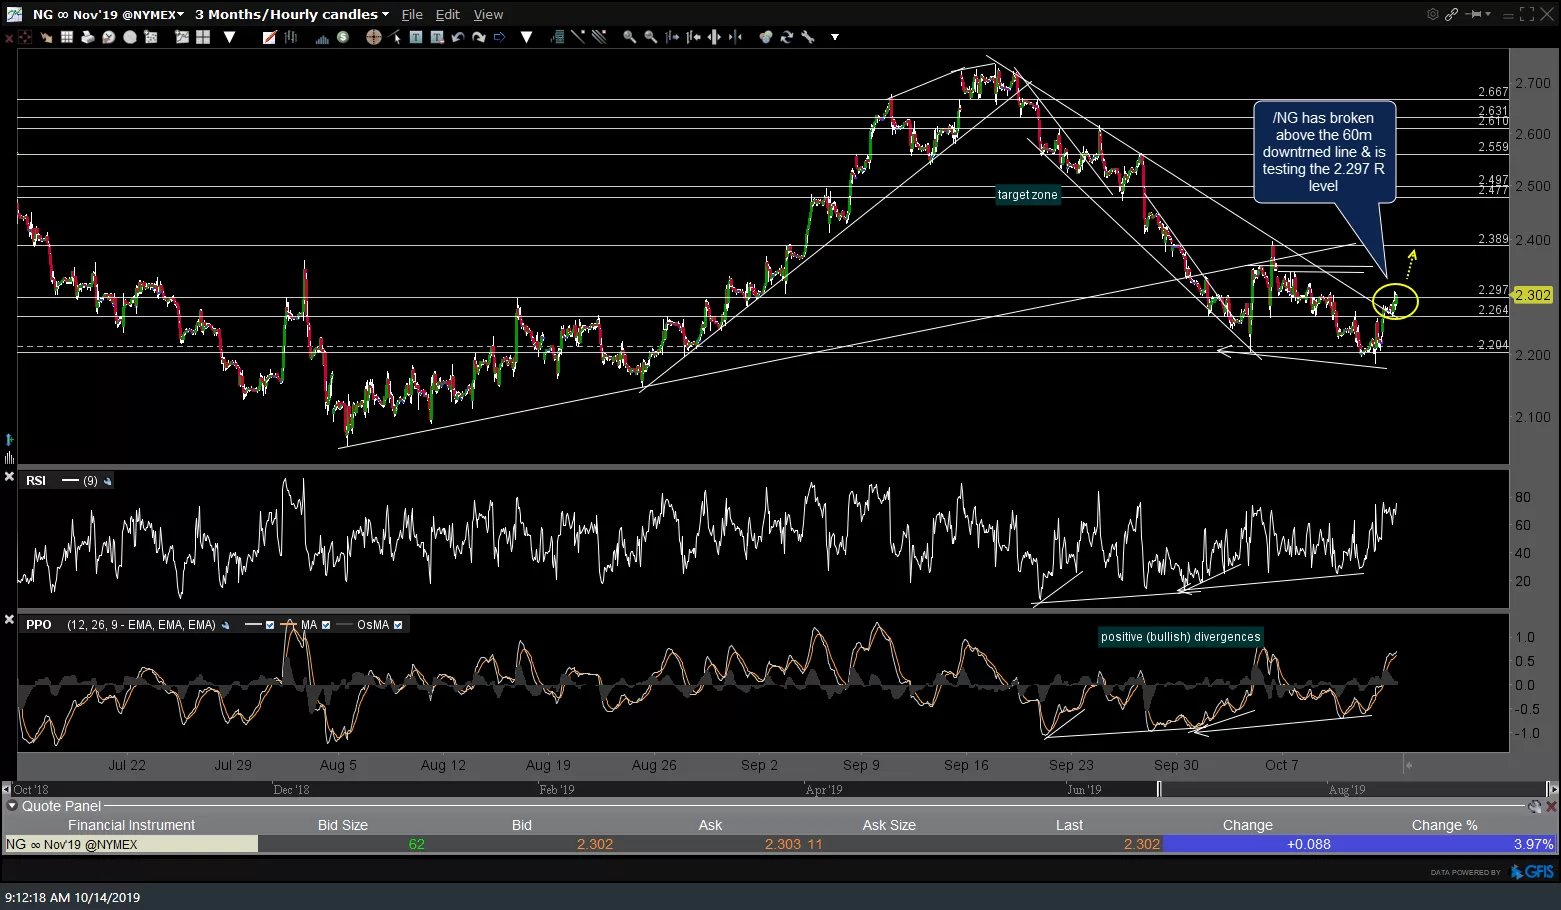
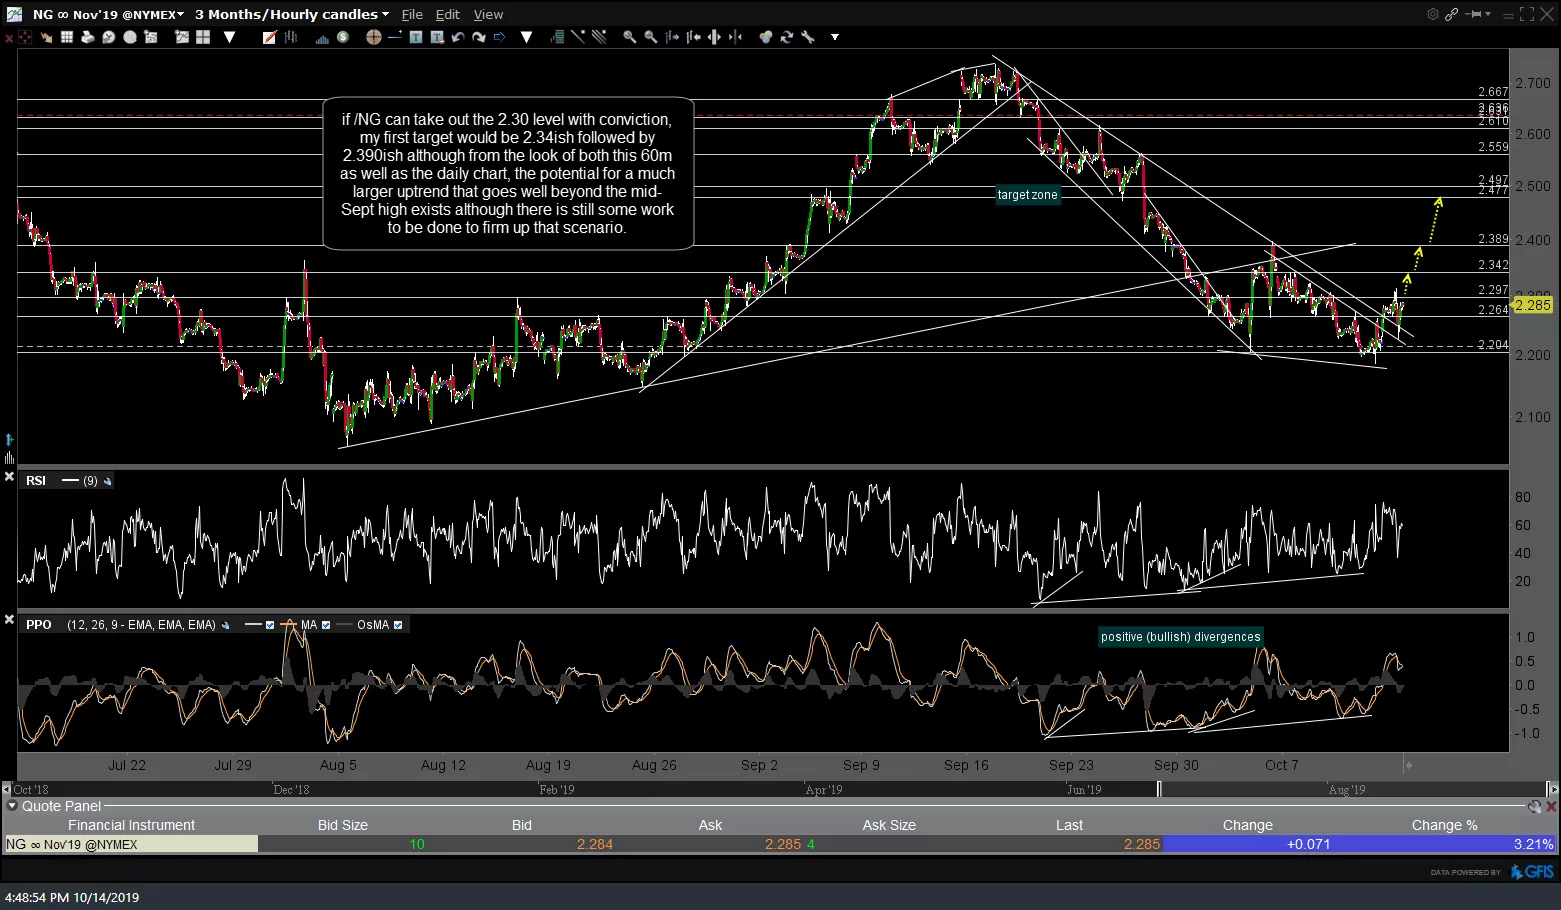
Since /NG (natural gas futures) was testing the 2.30ish resistance when posted in the Charts I’m Watching update earlier today, nat gas pulled back from that resistance level to make a successful backtest of the secondary (minor) downtrend line running parallel & just below the larger downtrend line off the mid-Sept highs. If /NG can take out the 2.30ish area with conviction, my first target would be 2.34ish followed by 2.390ish. From the look of both this 60-minute as well as the daily chart, the potential for a much larger uptrend that goes well beyond the mid-Sept high exists although there is still some work to be done to firm up that scenario. Previous & updated 60-minute charts below (click on first chart to expand, then click on right of chart to advance).
-

- NG 60m Oct 14th
-

- NG 60m 2 Oct 14th
Zooming out to the bigger picture via the daily charts, the recent correction following the recent divergent low & subsequent 34% rally appears to be the first corrective wave in what may likely prove to be a new uptrend with a lot more upside yet to come in natural gas. The previous (July & Sept) and updated daily charts highlighting that divergent low & likely ‘initial leg up’ rally below.
-
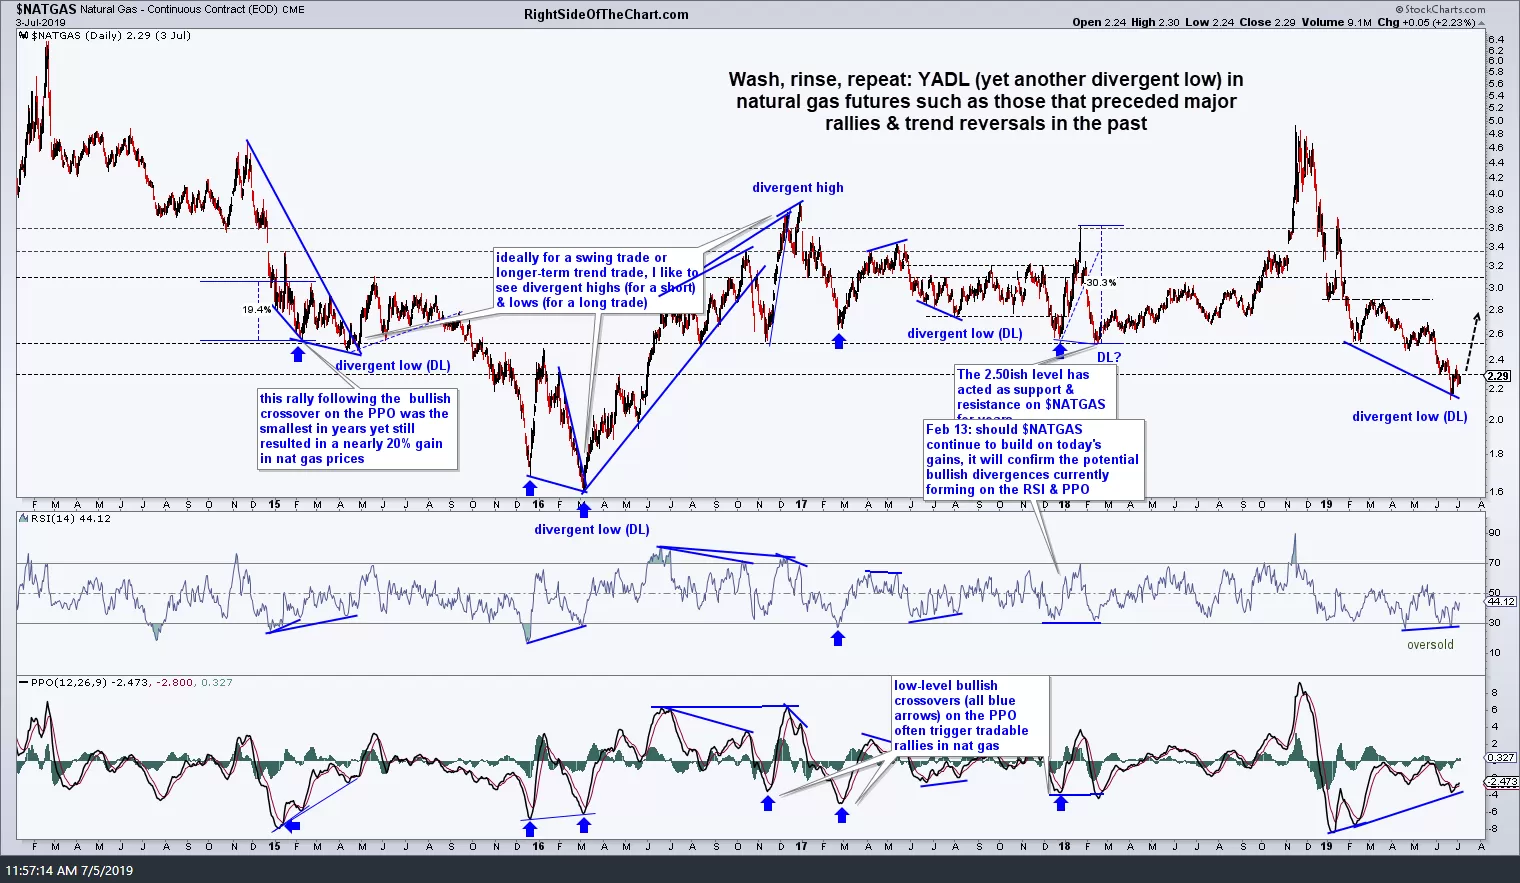
- $NATGAS daily July 5th
-
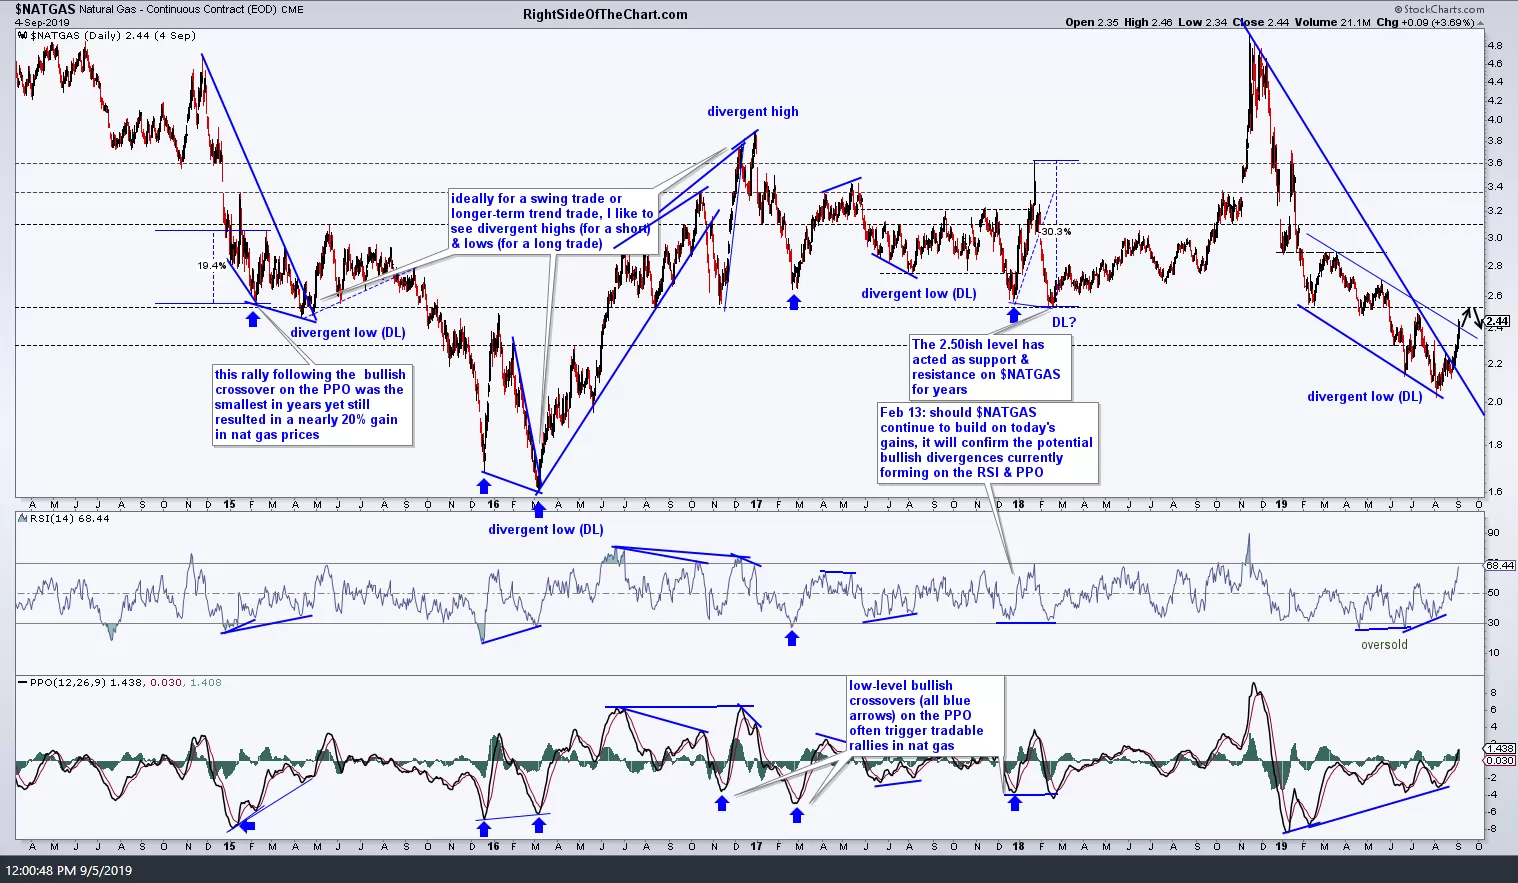
- $NATGAS daily Sept 5th
-
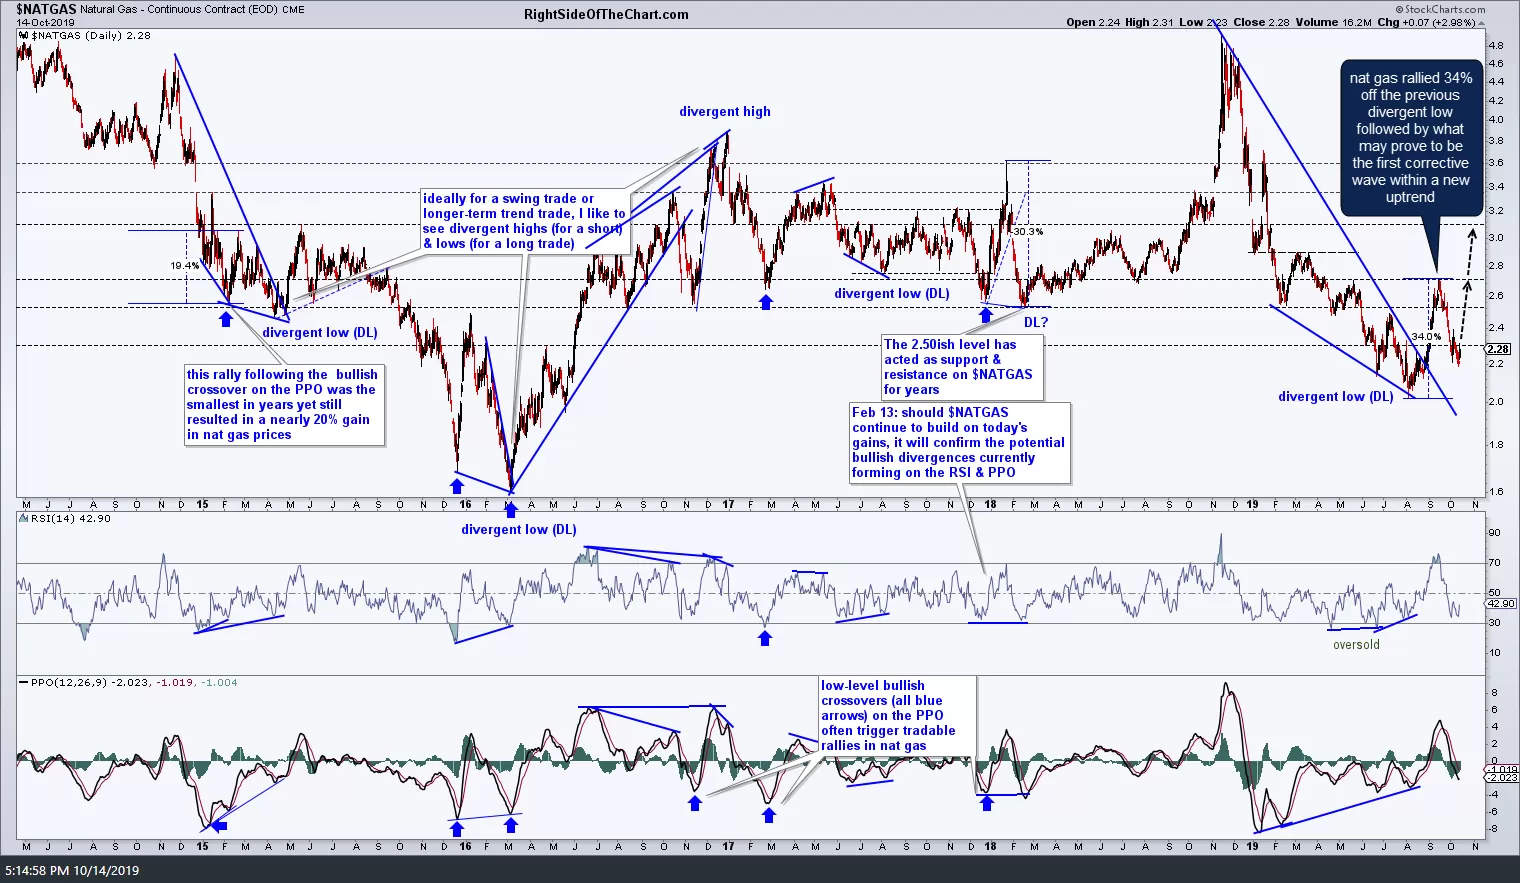
- $NATGAS daily Oct 14th
I’ve also included some potential targets (any or all marked levels) on this 60-minute chart of UGAZ (3x long/bullish natural gas ETN) but keep in mind that as these are unofficial trades for now, the price targets shown are the actual resistance level in which a reaction is likely, i.e.- ‘unadjusted’ price targets. As such, best to set any sell limit order(s) slightly below the actual resistance level(s) you are targeting, if currently long or considering a long on /NG, /QG*, UGAZ or any of the other natural gas ETNs such as UNG.
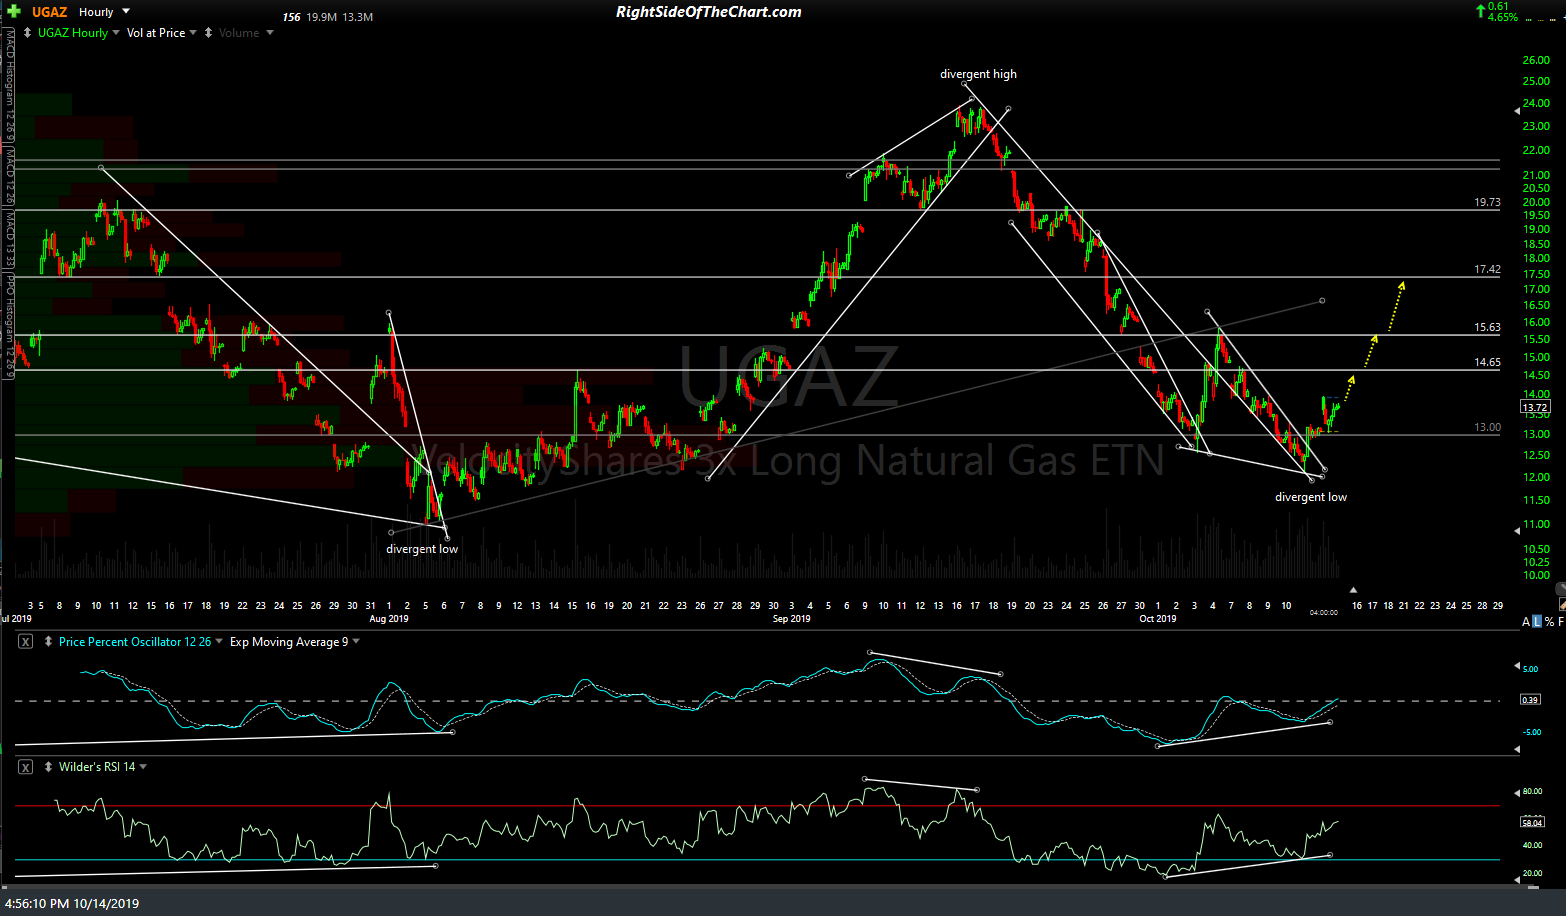
UGAZ 60m Oct 14th
*/NG is the Henry Hub natural gas futures contract with /QG being the NYMEX Natural Gas Index futures contract which has a multiplier of 2,500 (vs. the 10,000 multiplier of /NG), allowing one to trade futures with 1/4th the leverage of the standard /NG contract.