
Member @rashid asked for my opinion on RDUS (Radius Health Inc), as the stock is trading down very sharply today. With the scope of today’s drop (-14%), I’m willing to bet there is news which could be found on a quick web search of “RDUS Radius Health”, sorting by last 24 hrs only and/or the News sorting tab on Google. If I get a minute, I’ll see what I can find & post a link.
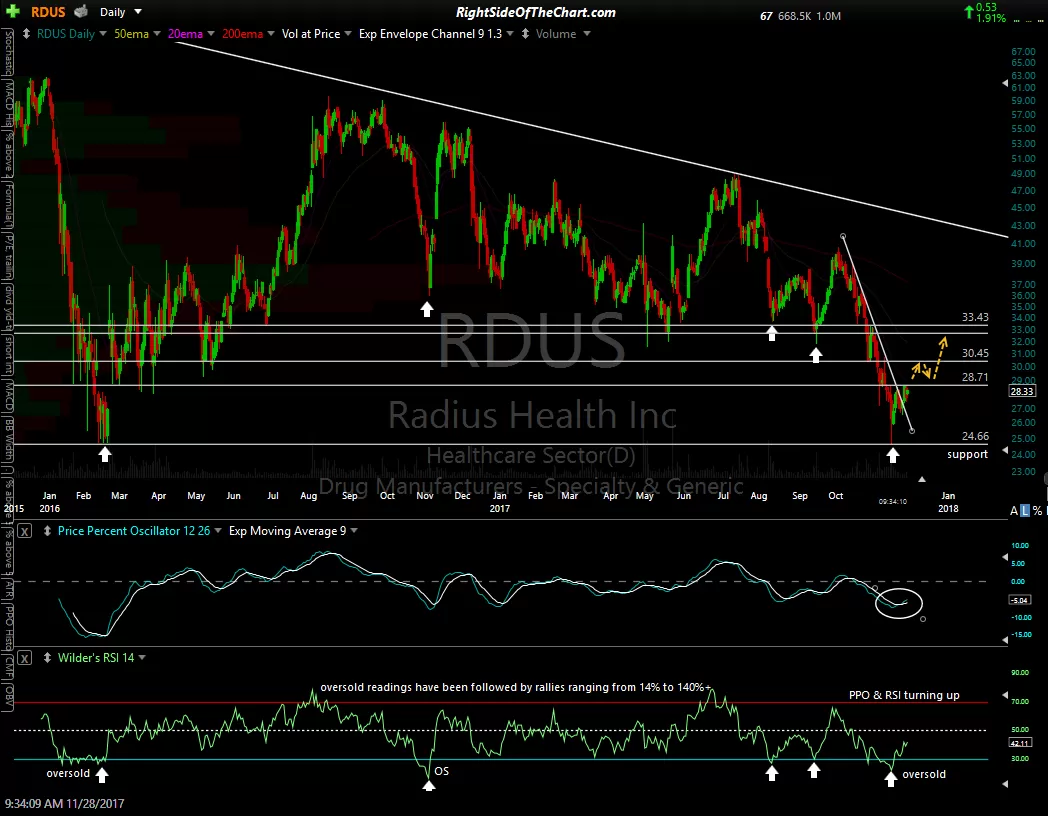
Regardless of the catalyst, I am a firm believer & have seen many, many times over the years that the fundamental catalyst for a big move in a stock (news releases, earnings, etc…) often coincides with a key technical development on the charts, such as a breakout of a bullish or bearish chart pattern, trendline, etc. In this case, RDUS was rejected off the primary downtrend line after rallying into it last week, just as it was rejected off the previous tag of that very well-defined & technically significant level back on January 29th.
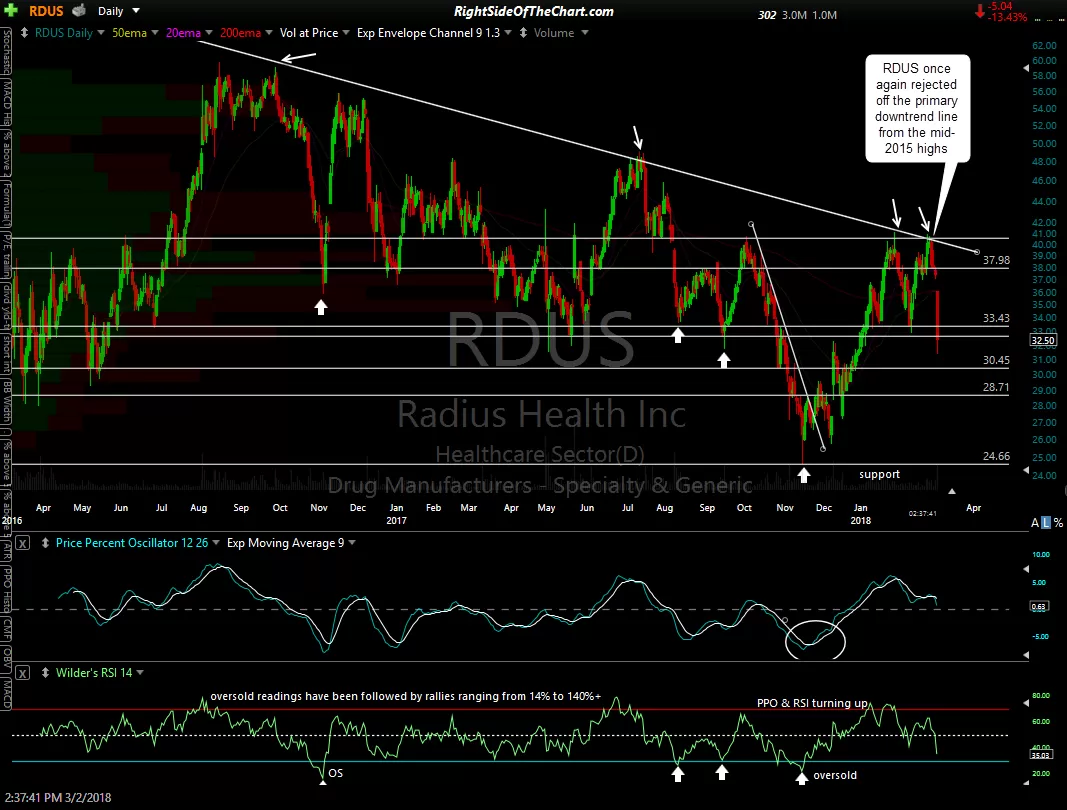
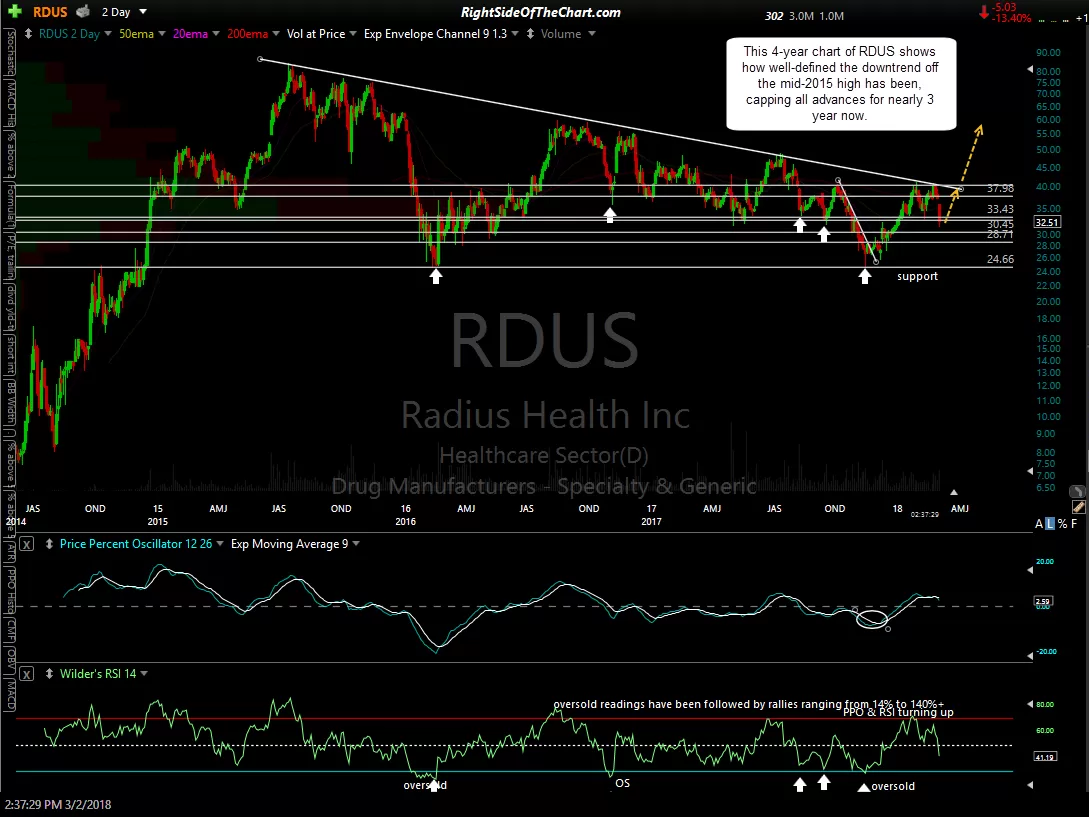
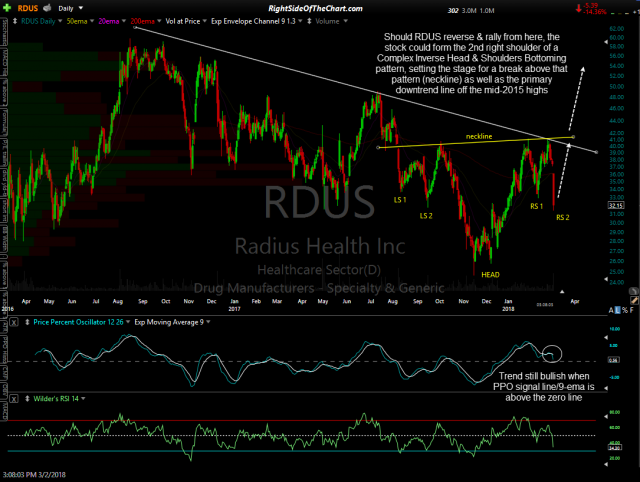
The first chart below was the daily chart that I posted when RDUS was added as a long trade idea back in late Nov ’17. You can see that same trendline back then although it continues to the left of that 2-year daily chart. Therefore, I have included a 4-year chart with 2-day candles to show the trendline in its entirety. Note all the reactions where all advances in the stock were capped since mid-2015. The more reactions off a trendline, the more valid or “strong” that resistance level is.
-
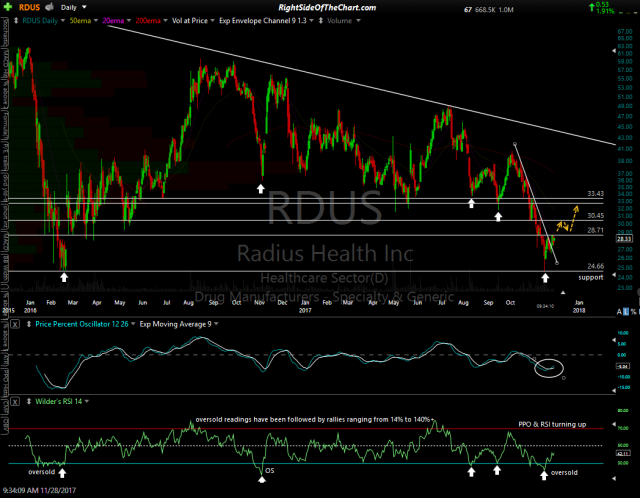
- RDUS daily Nov 28th
-

- RDUS daily March 2nd
-
- RDUS 4 yr 2-day March 2nd
-
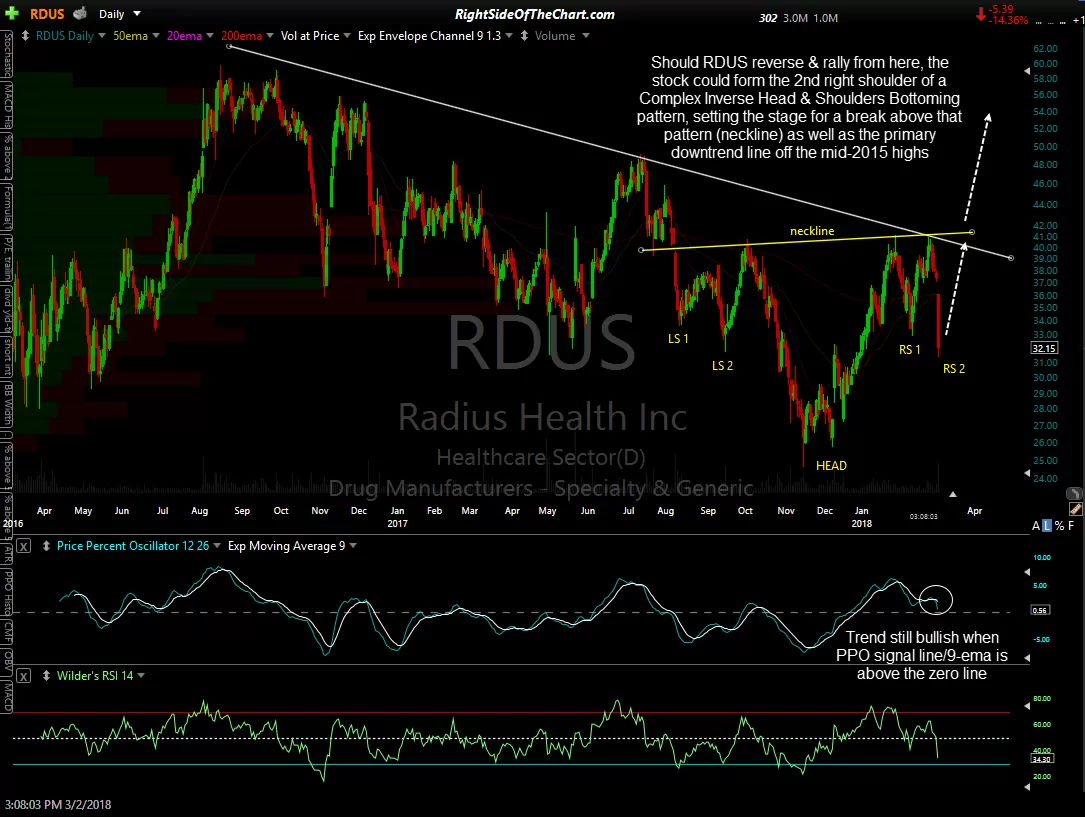
- RDUS daily Head & Shoulders Pattern March 2nd
click first chart above to expand, then click anywhere on the right of each expanded chart to advance to the next expanded image
Conversely, if & when RDUS makes an impulsive & convincing breakout above that downtrend line, especially with a solid daily close above, that would be a high-probability buy signal for a swing or trend trade in the stock (assuming some of the other technicals confirm at the time). Should the stock reverse & rally from here, it could form the 2nd right shoulder of a Complex Inverse Head & Shoulders Bottoming pattern, (which is an Inverse Head & Shoulders Bottoming pattern with two shoulders instead of one on each side of the head), setting the stage for a break above that pattern (neckline) as well as the primary downtrend line off the mid-2015 highs. I should note that this current move down is stretching the limits of the ideal symmetry for a Complex IHS Pattern so if the stock continues lower, that potential pattern will no longer be in play although any breakout above the primary downtrend line could still provide a longer-term buy signal.
As of now, Radius has fallen back towards a support zone that I’ve traded the stock off of recently. The stock overshot the bottom of that zone briefly early today, most likely due to the downward momentum but so far has bounced off the lows & is trading just at the bottom of that support zone now. Not sure what the news is yet but if it isn’t too bad, RDUS might offer another objective long entry here with a stop below today’s lows although it would be prudent to wait for some decent evidence of a reversal & to check for the fundamental catalyst for today’s drop before stepping in.