
RDUS (Radius Health Inc) will trigger a entry on any break above 28.72. On November 14th, this biotech company fell to long-term support (24.66) while deeply oversold. As shown on the daily chart below, all prior oversold readings in recent years were followed by rallies ranging from 14% to over 140%.
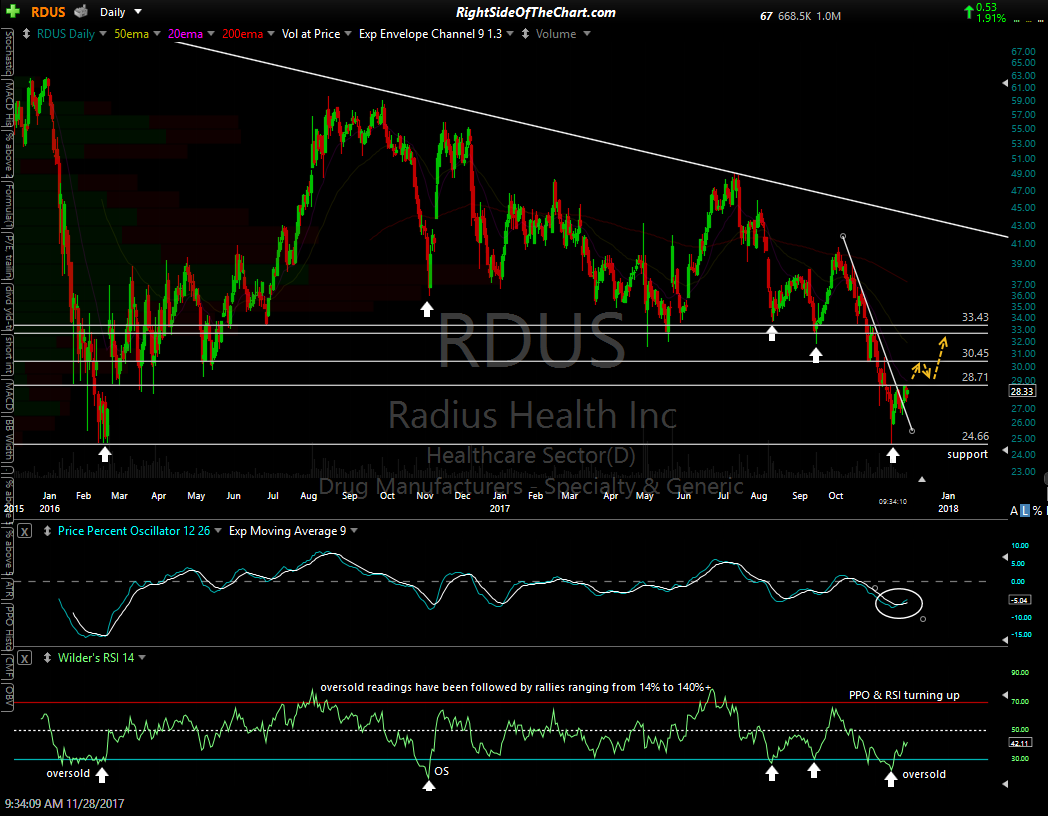
RDUS daily Nov 28th
The entry on this long-side swing trade is based off the 60-minute chart, just above the 28.71 resistance level. Radius recently broke above the 60-minute downtrend line, followed by a successful backtest & appears poised for another thrust up towards the next resistance level around 30.50 once the 28.71 level is taken out with conviction. RDUS also appears to have potential as a bottoming play for longer-term trend traders & investors. Price targets for this trade are T1 at 30.43, T2 at 31.97 & T3 at 33.34. The maximum suggested stop is any move below 27.19. The suggested beta-adjusted position size is 0.90.
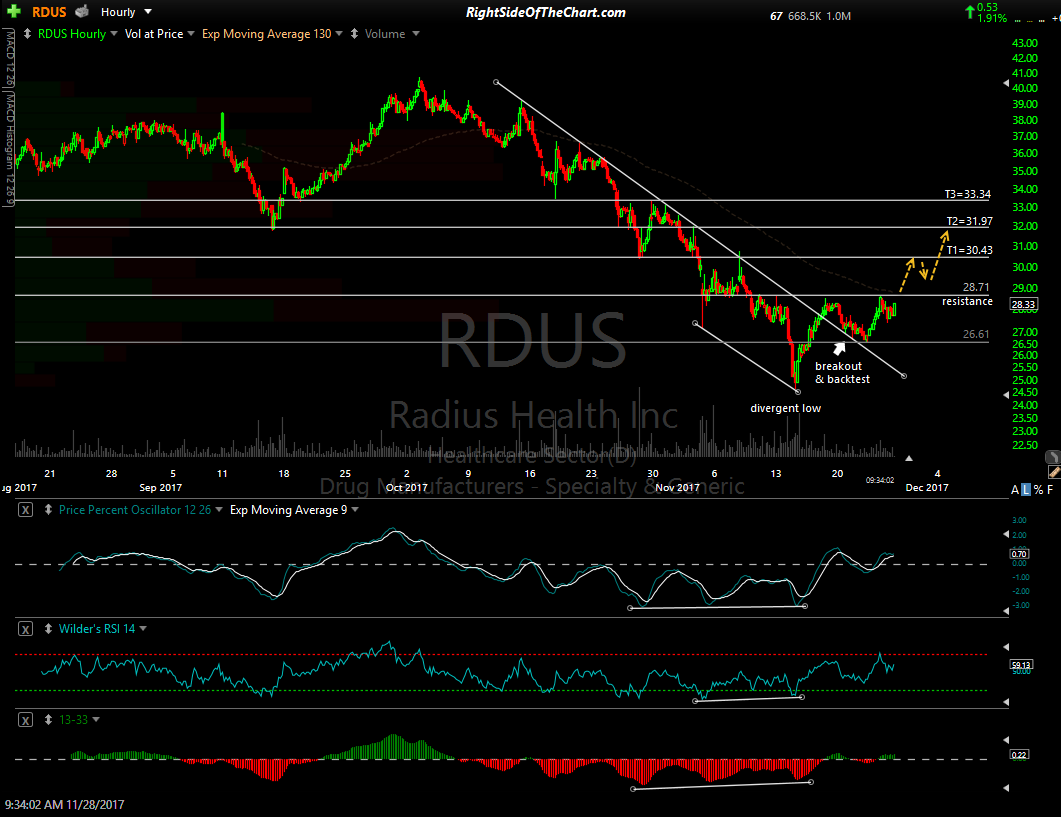
RDUS 60-min Nov 28th