
The 60-minute chart of /NQ summarizes the significant or “swing tradable” developments on the Nasdaq 100 in the month of June as we head into the final trading day of the month & second quarter.
NQ 60m June 30th
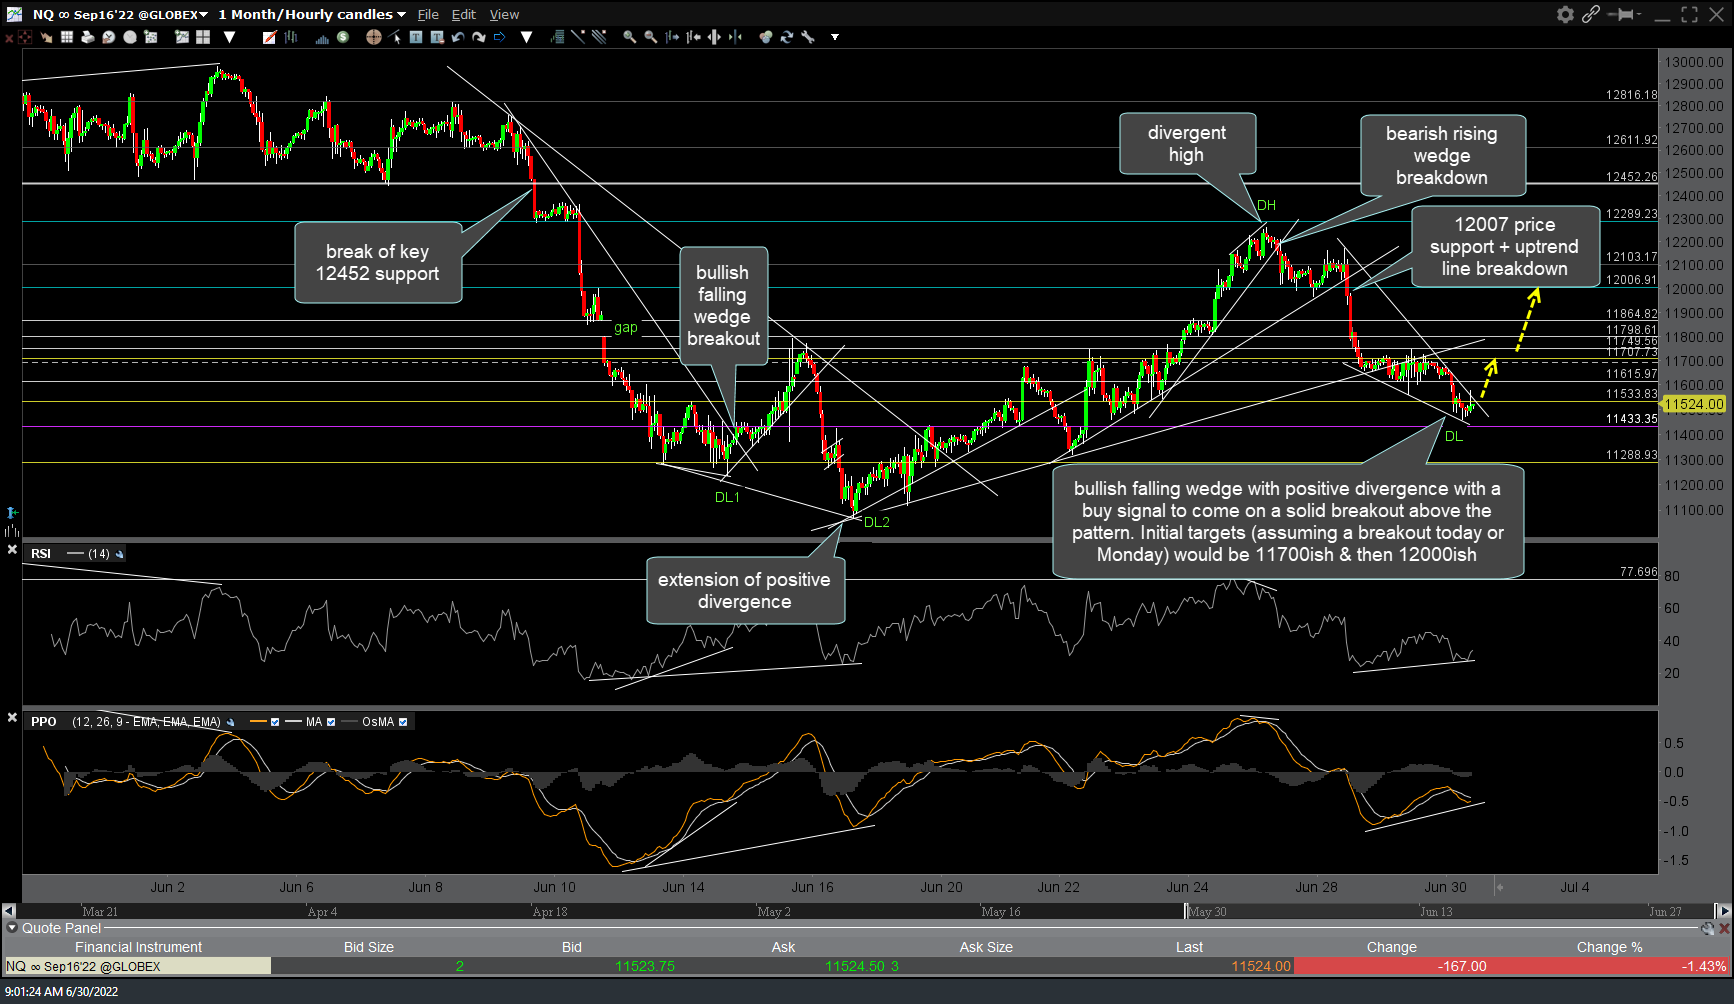
Essentially, the Nasdaq futures started the month in a sideways trading range which was well-defined with the 12452 support level on the downside. That support level was taken out impulsively on June 9th, followed by an 11% drop from there.
That 11% drop ended with a divergent low on June 16th (preceded by a bullish falling wedge with a smaller divergent low & 5%+ rally shortly before that bottom) followed by a 10%+ rally into the June 27th divergent high. On that same day (June 27th), /NQ went on to break down below a bearish rising wedge followed by the (so far) drop of ~6.5% which takes us to where we are shortly before the opening below with what appears to be another bullish falling wedge pattern, complete with positive divergences on the 60-minute time frame. As such, a buy signal for /NQ, QQQ, QLD, etc.. would come on a solid break and/or 60-minute close above the falling wedge pattern with initial short-term targets of ~11700 & ~12000.
Should the Nasdaq fail to break out and/or any breakout prove to be a whipsaw/false breakout, the support levels to watch below (and or set stops somewhat below) would be ~114300 & then ~12290. I’ll post some additional analysis & commentary an hour or so after the regular session has gotten underway.