I’ve pulled charts going back 6 years in order to show how the market traded in the weeks following the Thanksgiving holiday in the U.S. with a focus on the initial ‘micro-trends’ or direction (up or down) and magnitude (percentage gain/loss) in the following days to weeks after Thanksgiving. Essentially, the results are mixed without a clearly identifiable pattern of a rally (bullish) or pullback (bearish) following the Thanksgiving holiday. Some other considerations are the fact that 6 years of statistics is a relatively small number of sampling points with an additional consideration that all 6 data points were taken during a bull market as one might expect a higher incidence and magnitude of post-holiday negative returns during a bear market.
As such, I don’t see a clear edge or advantage to positioning long or short in expectation of a rally or correction heading after the Thanksgiving holiday later this week but I do see a fairly consistent pattern of relatively low volatility leading up to & during the week of Thanksgiving followed by expanding volatility as well as gains or losses in the market (I used the S&P 500 tracking ETF, SPY for these examples).
I marked up these charts without any bias or slant to try and make either a bullish or bearish case but rather to 1) either confirm or refute the comments that I made earlier today as to why I prefer to keep things light (both active trades plus new swing trade positions) during the usually low-volume week of Thanksgiving due to increased whipsaw signals (false breakouts) and 2) to try and identify any other patterns that might stand out leading up to & after the Thanksgiving holiday.
While the initial reaction (rise or fall of 2% or more following from the high of trading on the day after Thanksgiving) was a wash, with half (3) of the post-holiday moves being negative & the other half positive, what stands out to me is a somewhat consistent pattern of stocks rising leading up to the week of Thanksgiving followed by that 50/50 chance of a pullback or rally from there. Also worth noting are the subsequent reversals that followed some (but not all) of the initial pullbacks or rallies as well as the mostly bullish bias in the last week or so of trading at the end of the year (all charts show trading from Nov 1st – Dec 31st).
Again, nothing very compelling or clearly actionable here but I figured that it was worth passing these charts along for those interested. The charts below are in chronological order. Click on the first chart (2013) below to expand it, then click anywhere on the right of each expanded chart to advance to the next one. Once a chart is expanded, it can be panned & zoomed for additional detail.
-

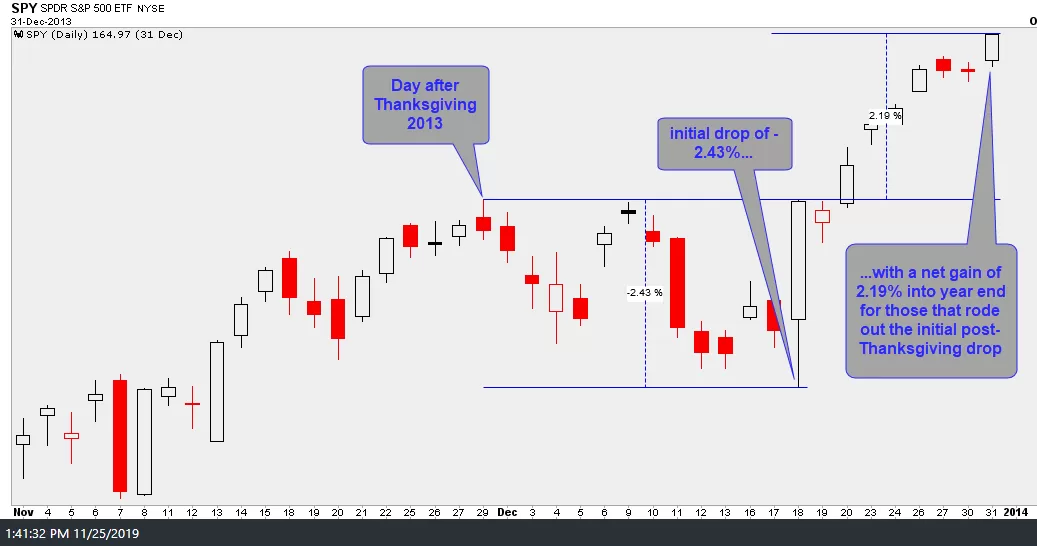
- post-Thanksgiving 2013
-

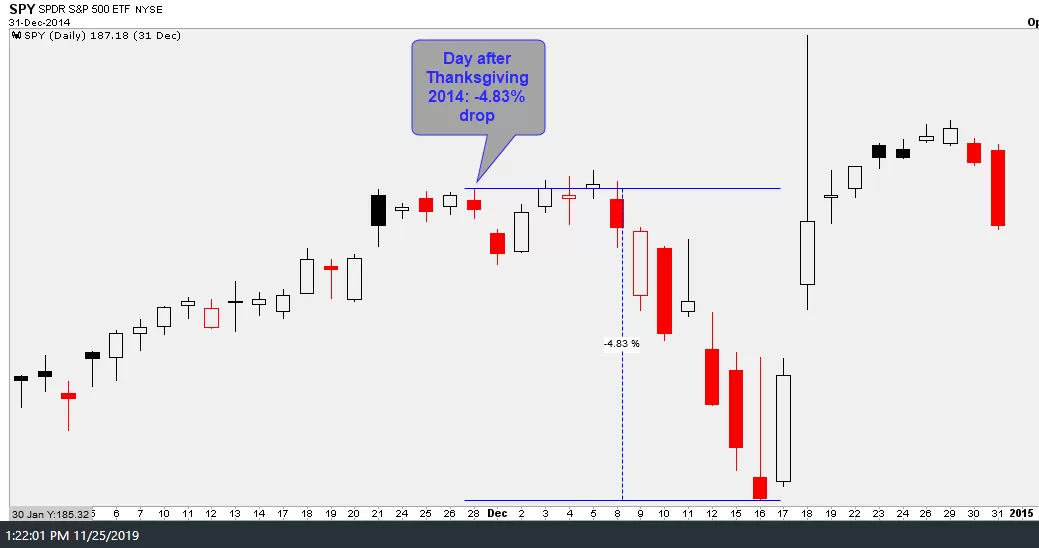
- post-Thanksgiving 2014
-
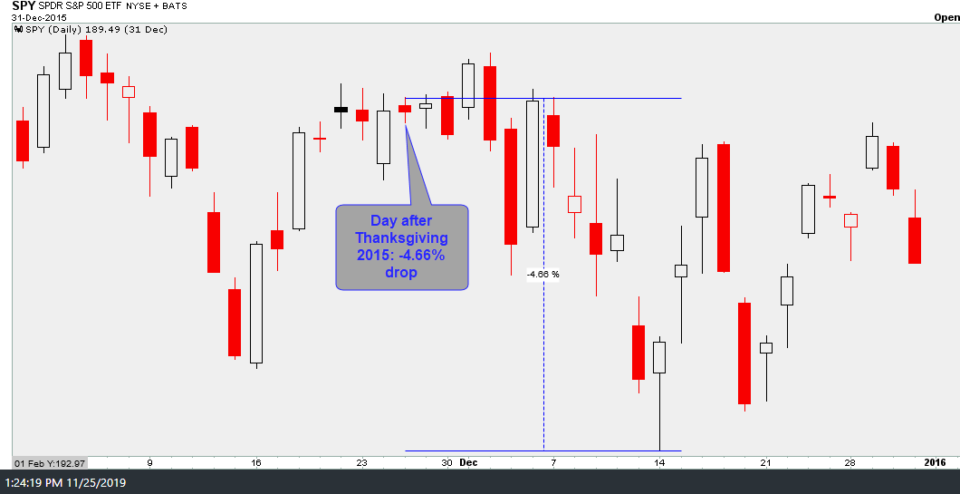
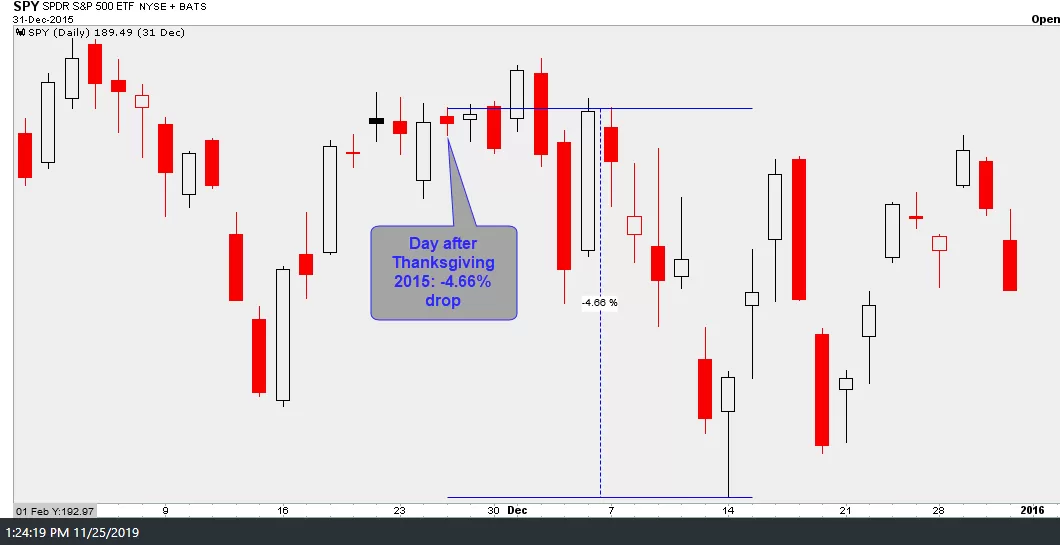
- post-Thanksgiving 2015
-
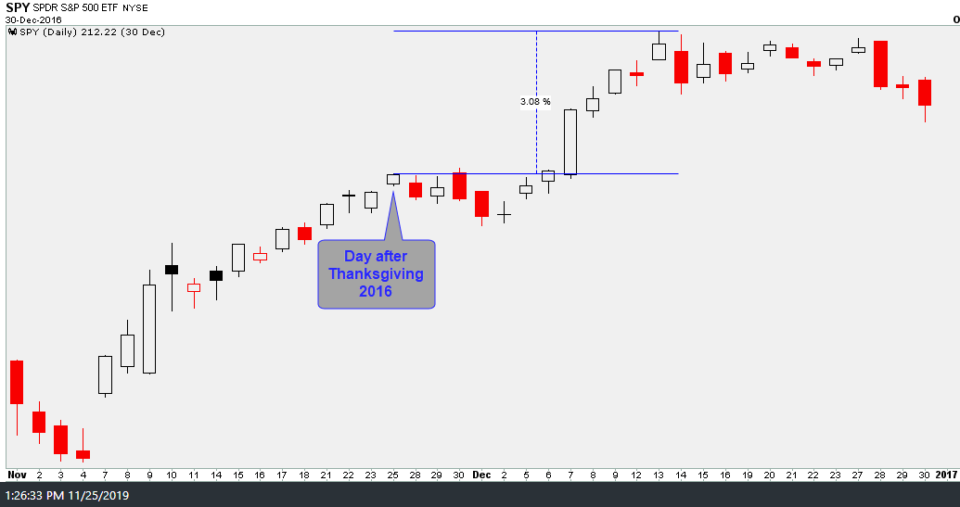
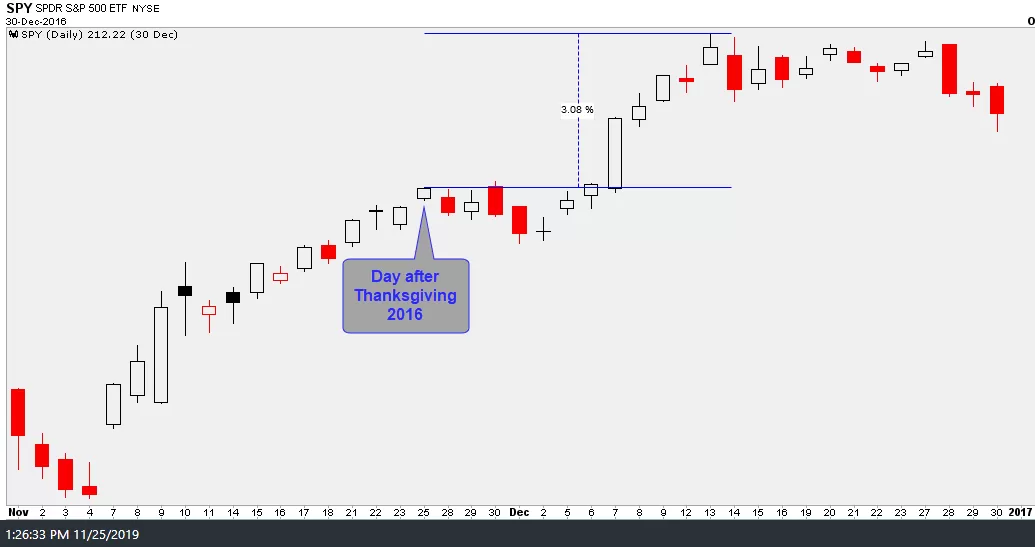
- post-Thanksgiving 2016
-
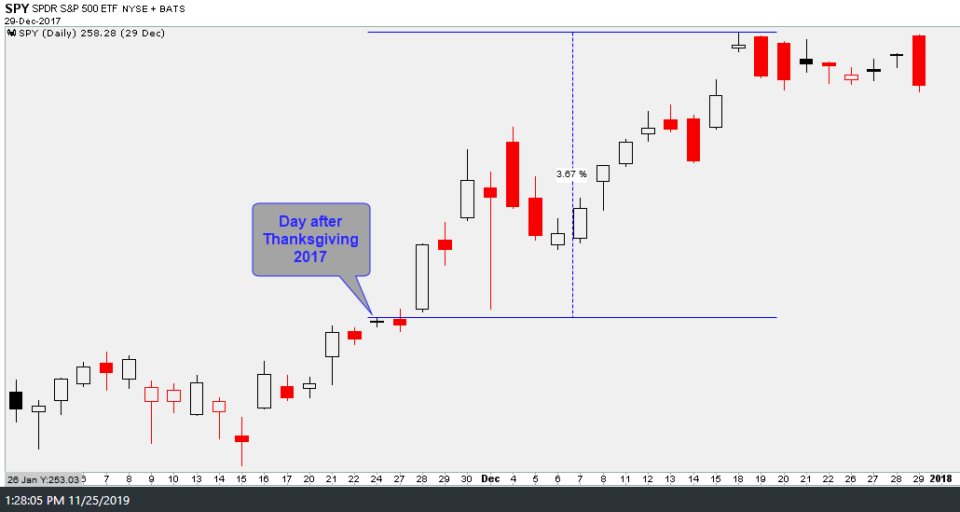
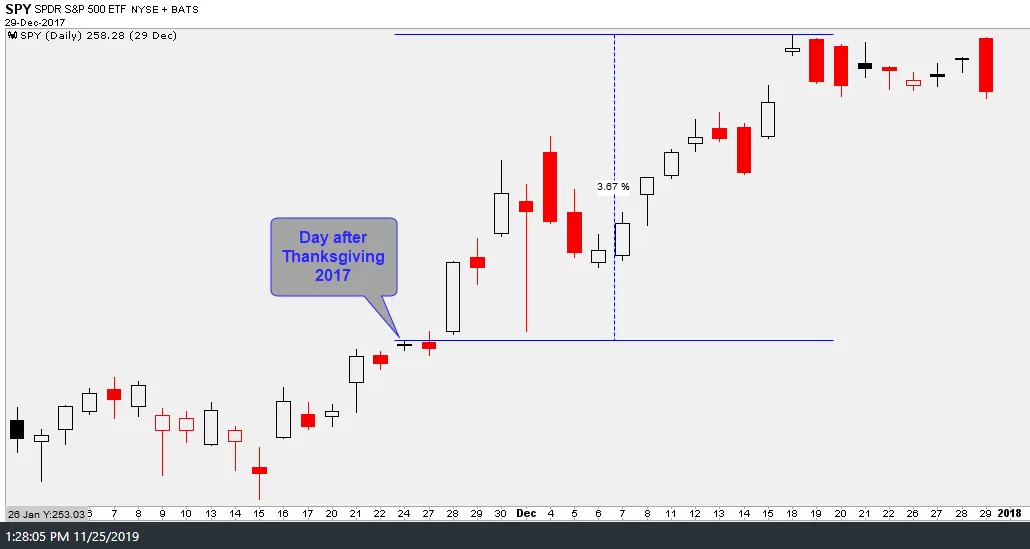
- post-Thanksgiving 2017
-
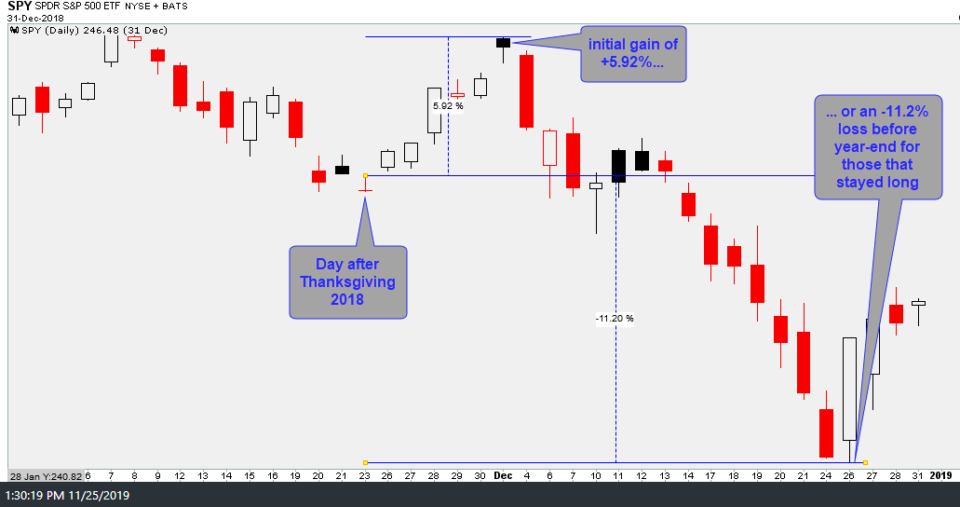
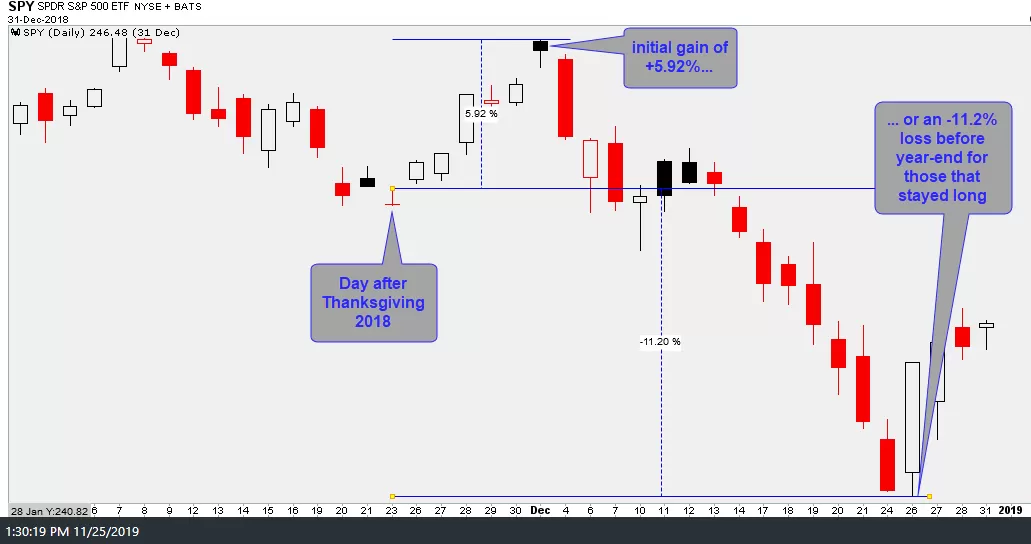
- post-Thanksgiving 2018