
PAYX (Paychex Inc.) appears poised for a substantial correction pending a sell signal & will be added as an official Short Trade Setup with an entry to be triggered on any break below 85.99, which will have taken the stock down below the uptrend line on this daily chart below.
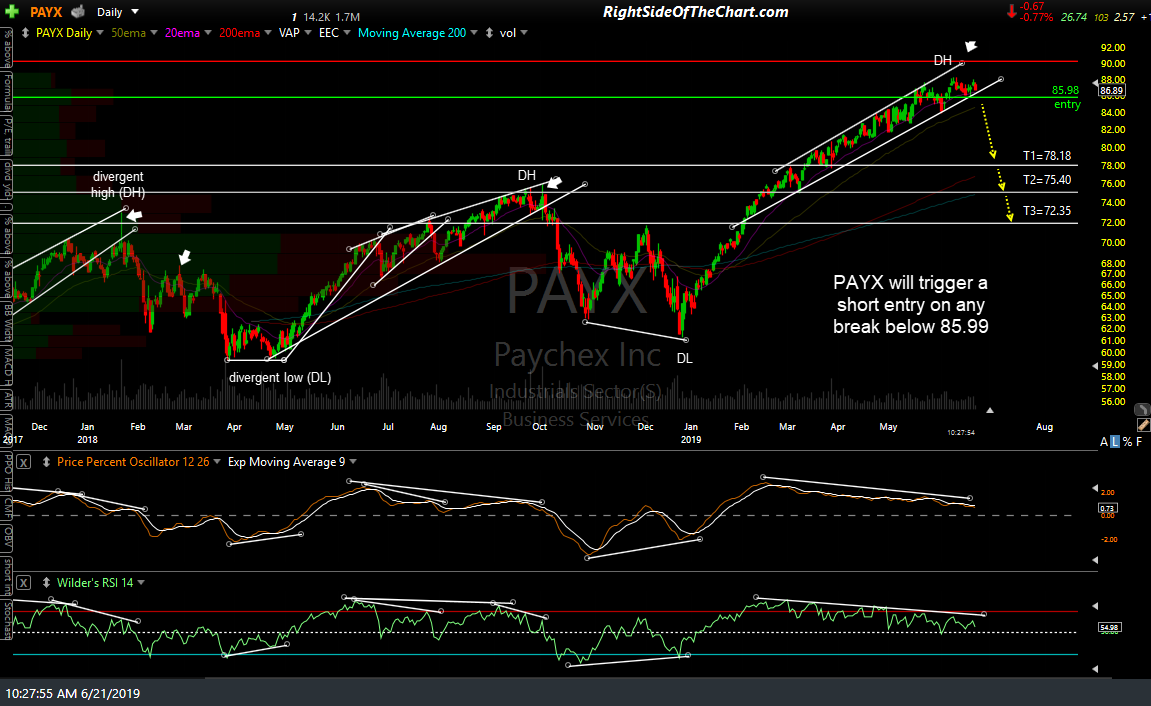
PAYX daily June 21st
As per the multiple bearish developments covered in this 10-yr weekly chart in the PAYX video below, the stock appears poised for a ~20% drop in the coming months pending a sell signal on the daily chart.

PAYX weekly June 21st
The price targets for this trade are T1 at 78.18, T2 at 75.40 & T3 at 72.35 with a suggested stop of a daily close above 90.33 (or lower, if only targeting T1). The suggested beta-adjusted position size for this trade is 1.0.