
The first chart below shows a 21-year history of the platinum to palladium ratio. The last time the platinum to palladium ratio was this low nearly two decades ago was followed by a mean reversion between the two related metals that resulted in a nearly 90% bear market in palladium over the next two years.
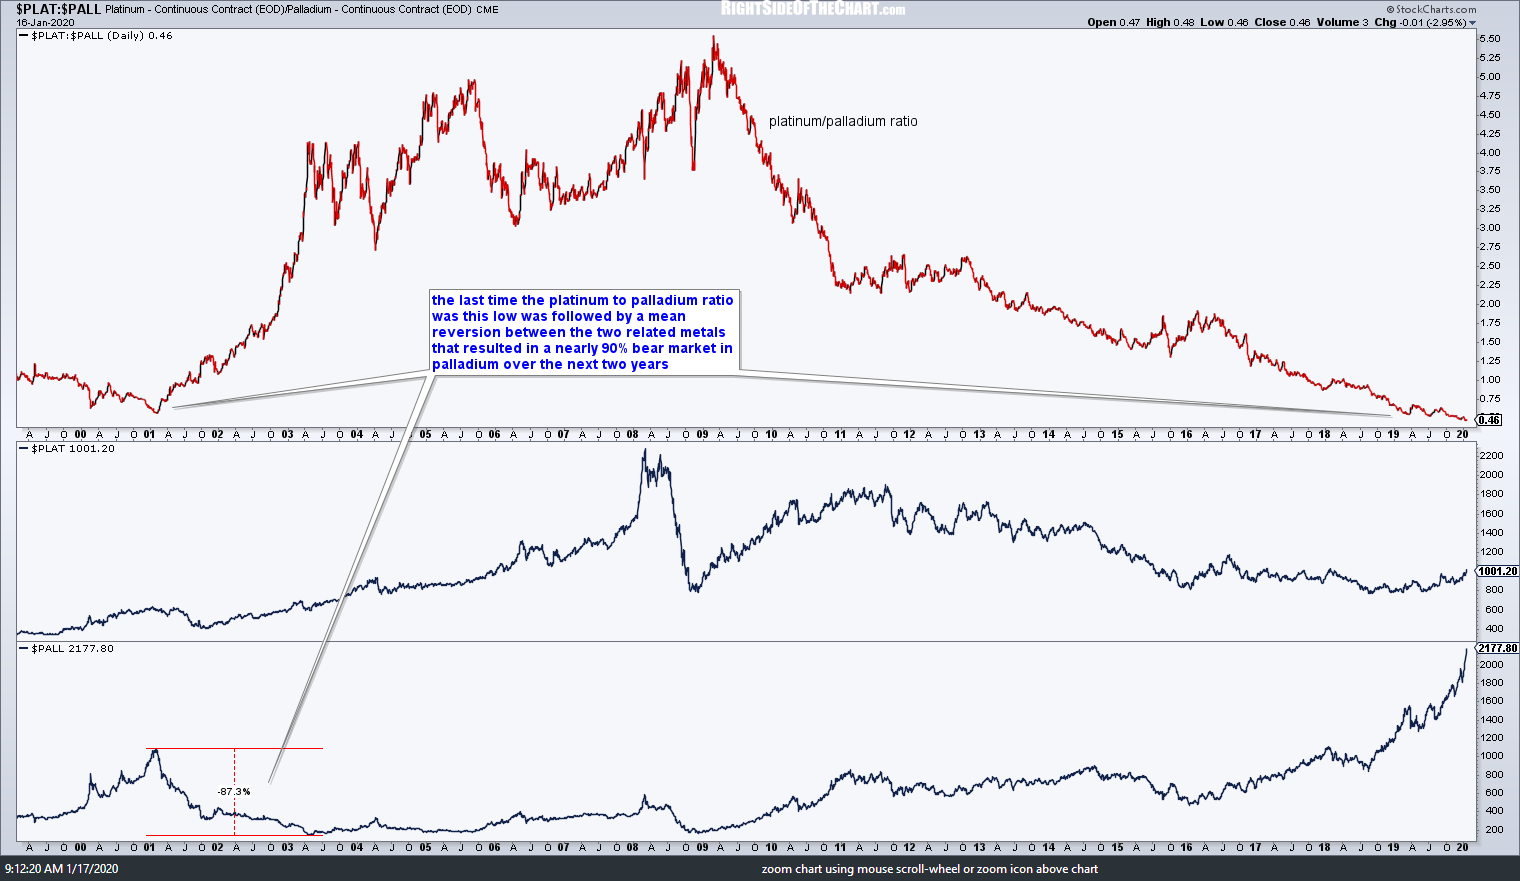
$PLAT-$PALL ratio Jan 17th
The next chart below is a 21-year weekly chart of $PALL (Palladium futures, end-of-day chart through yesterday’s close) highlighting how significant tops usually follow extreme overbought readings with major tops following divergent highs. Once the top in palladium finally comes, which may quite likely precede a break below this uptrend line, the fall is likely to be sharp & swift with a minimum long-term swing target of 1100, 50% below current levels.

$PALL weekly Jan 17th
Zooming down to the daily chart of PALL (palladium ETF), parabolic runs that come during an extended & extreme bull market typically don’t end very well. While we don’t have any sell signals yet, PALL is on watch for an official short entry with a minimum swing target of at least the 170.80ish area (22% below current levels).
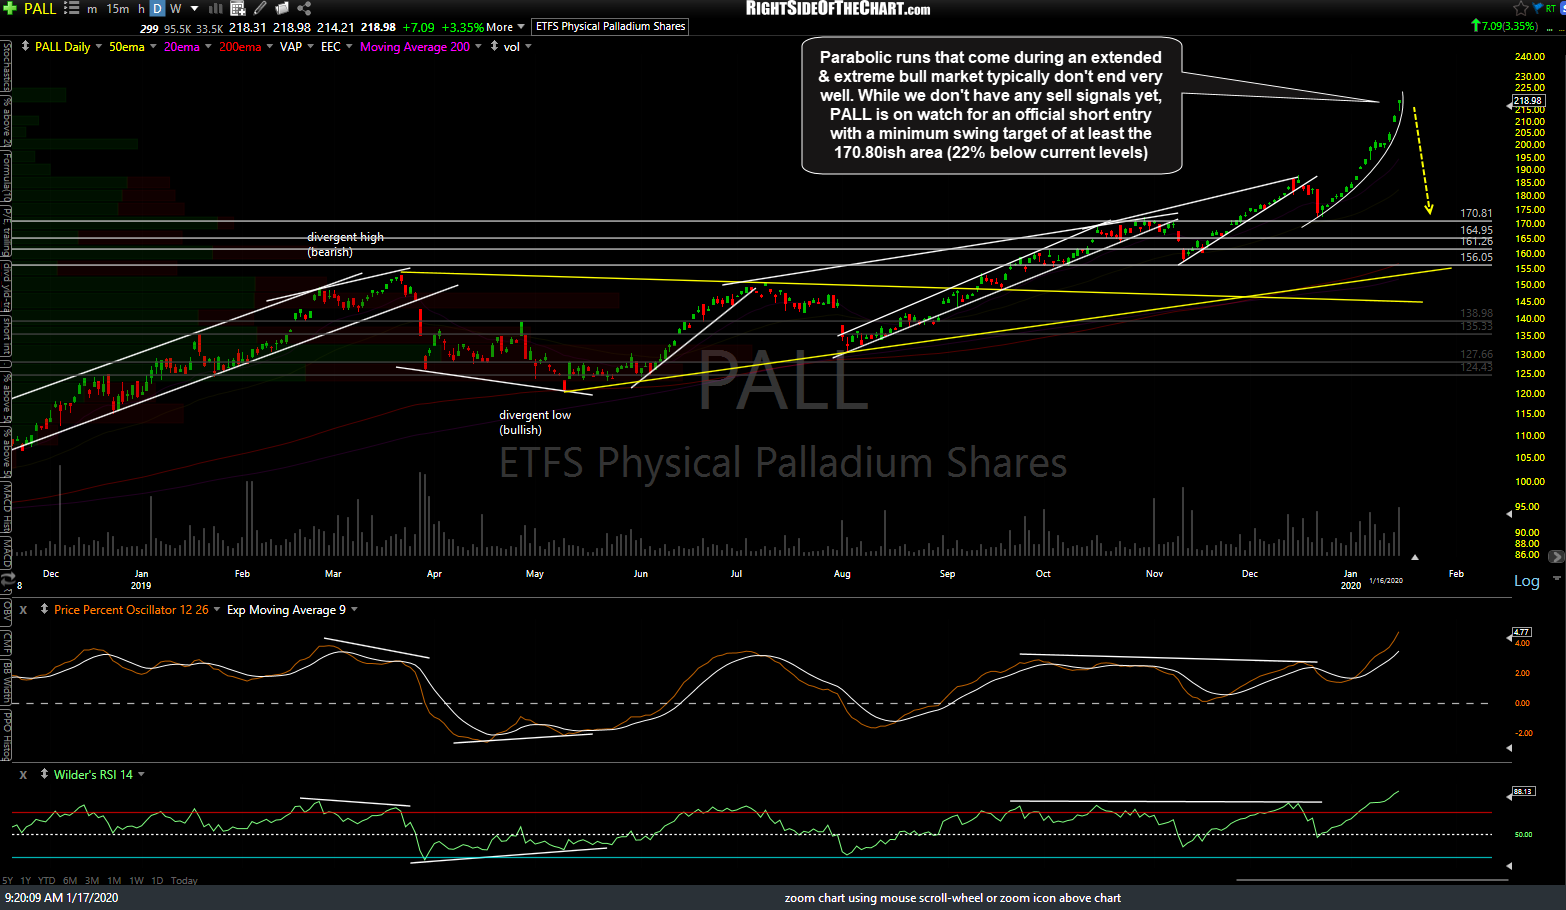
PALL daily Jan 17th