
Member @francisq has been consistently posting some nice market analysis (thanks!), including some developments on the long-term chart of SPY earlier today in this thread: https://rightsideofthechart.com/members/francisq/activity/37442/ (note: trading room access is restricted to Gold level members & free trial members)
That prompted me to look at the monthly chart of SPY, particularly in regards the posture of the MACD. I prefer to use a PPO on long-term charts, especially weekly & monthly charts spanning years or decades (I posted some links on using the PPO in this thread earlier today: https://rightsideofthechart.com/members/wedg567/activity/37410/ )
What stands out to me is what appears to be a likely & imminent bearish crossover on the PPO. At times, the PPO (a close cousin to the MACD indicator) signal line will bounce off the PPO line when a crossover appears imminent, thereby keeping the current trend intact, much more often than not, once the PPO histogram falls down to just above the zero line from above, it ends up crossing down below shortly afterwards.
The PPO histogram provides a graphical representation of the differential between the PPO line & it’s respective signal line, the 9-ema; the higher (green) or lower (red) the bars, the greater the difference between the two lines. When the two lines begin to converge, the histogram will contract, ultimately crossing below or above the zero line once the PPO signal line crosses below or above the PPO line. (Ditto for the MACD & MACD histogram).
This monthly chart of the SPY below goes back to the mid ’90’s, capturing the previous record long bull market that culminated with the dot.com bubble. The PPO histogram was clearly green thoughout most of that bull market & clearly red throughout most of the post-dot.com bear market that followed.
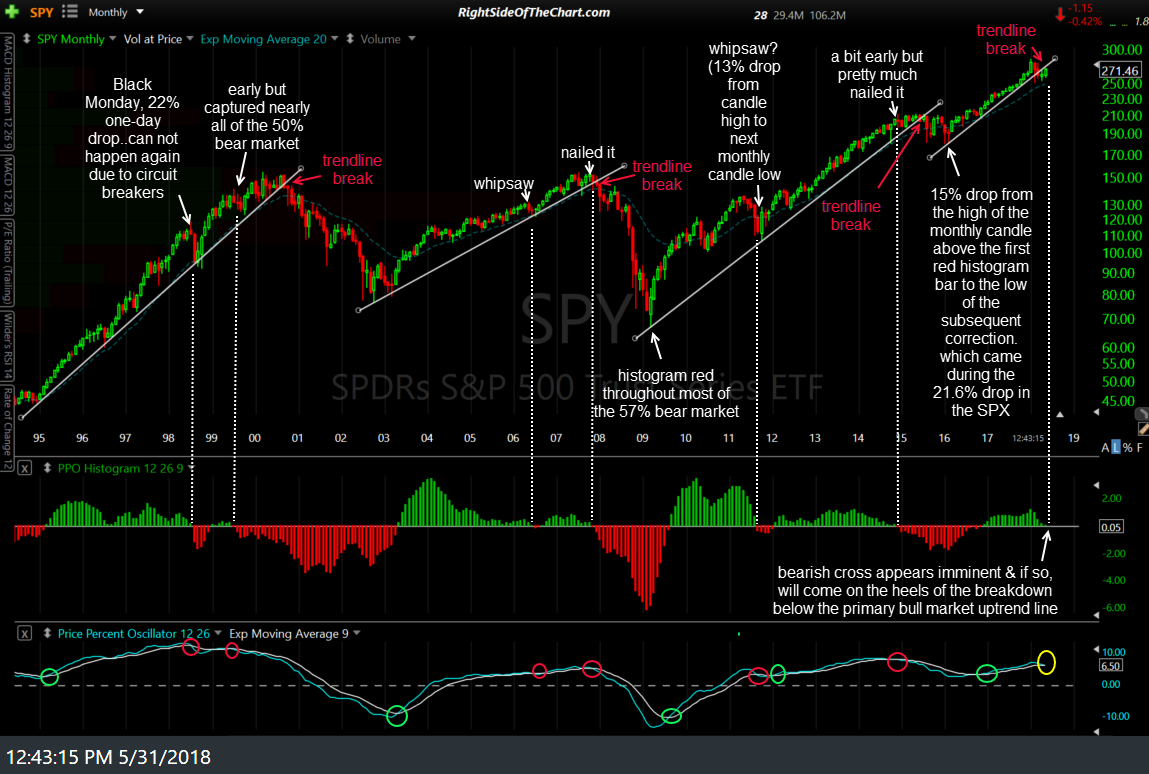
SPY monthly PPO crossovers 5-31-18
I placed vertical lines at each point where the PPO histogram crossed below the zero line (i.e., where the PPO signal line also crossed below the PPO line, providing a long-term sell signal) over the past 3 decades+. Best to exclude the whipsaw signal from bearish PPO cross back in October 1987 as that was due to Black Monday, a market crash of 22% in a single day which is no longer possible due to circuit breakers that were implemented in the wake of Black Monday to prevent any future one-day market drops anywhere close to that magnitude.
As with any indicator, especially a very simply one without a lot of moving parts, this one is not immune to whipsaw (false) buy & sell signals. Essentially, over the past 3 decades or so and quite possibly beyond, we’ve had one to three (depending on how one interprets them) whipsaw signals along with three sell signals (i.e.- bearish PPO crossovers) that proceded both bear markets since, or all 3 bear markets, if one counts the 21.6% decline in the S&P 500 from its high on May 2, 2011 high to its low on Oct. 4, along with most other major indices also exceeding a 20% drop— more than enough to satisfy the semiofficial definition of a bear market as a 20% or more decline.
Finally, as I often say, I never use any one bullish or bearish technical event as a stand-alone buy or sell signal, instead preferring to see multiple trend indicators & other buy or sell signals trigger within close proximity. At this risk or oversimplifying things, on the 30+ year monthly chart above, if one were to only use the second of both a bearish crossover on the PPO and a breakdown below below the well-defined primary uptrend lines on this chart, the failure rate for those dual, confirming signals would be zero.
As SPY has already broken down below the most recent primary uptrend line*, now we just need the additional confirmation via a bearish crossover on the monthly PPO. Keep in mind that any buy & sell signals using the monthly charts are only triggered on a monthly close. As such, with today being the last day of May & the PPO histogram current poised to close the month at a reading of +0.05%, we’ll just have to wait until the end of June to see whether or not this apparently immienent bearish crossover occurs or if we get one of those rare kiss & bounce of the PPO lines, with a resumption of the uptrend.
*I’ve recently highlighted two uptrend lines on the SPY weekly chart, the smaller of which is the same trendline on this monthly chart with SPY currently testing the larger trendline, generated off the March 2009 lows, from above.