
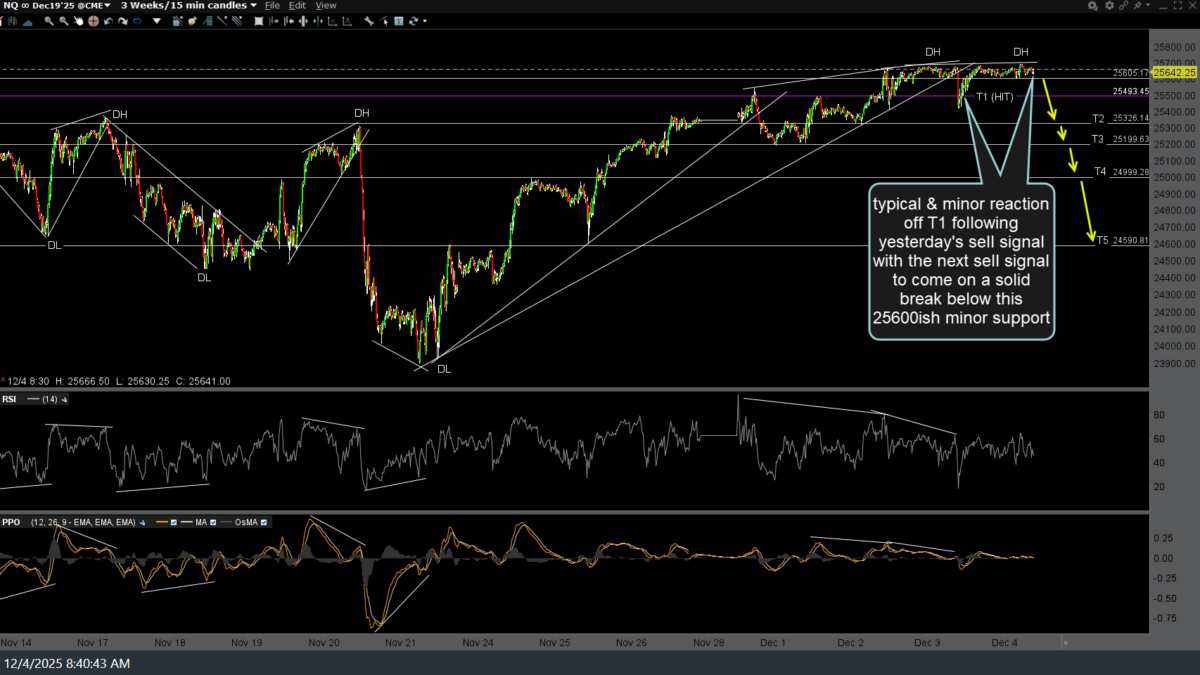
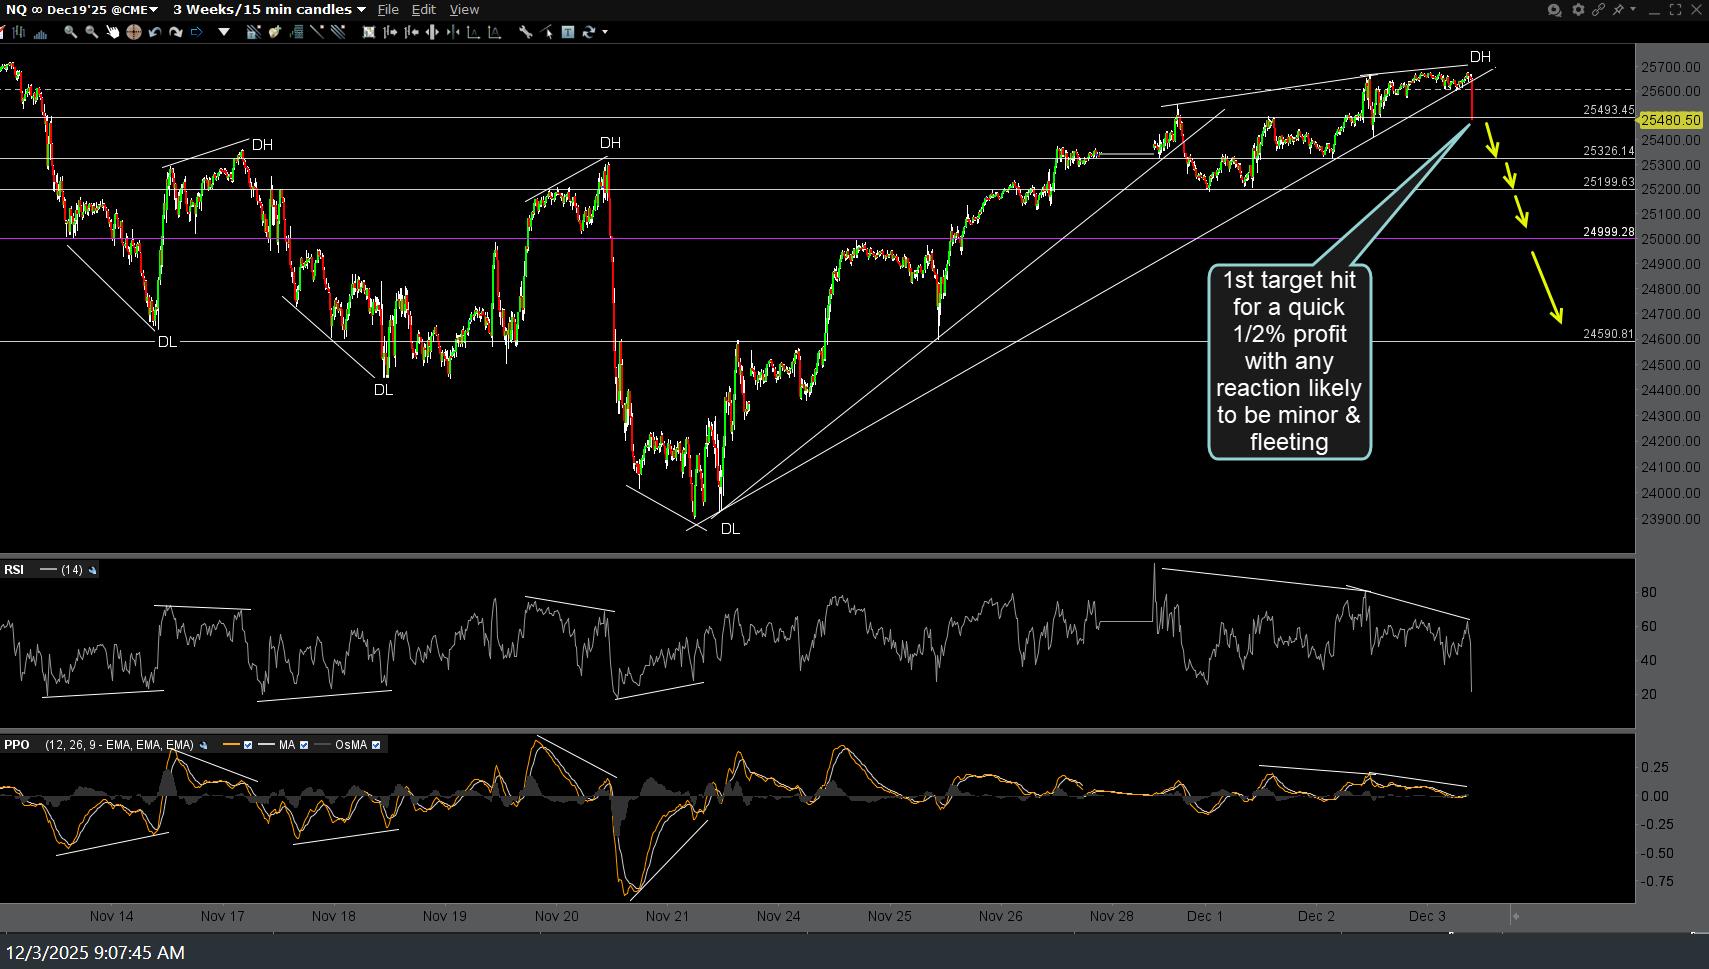
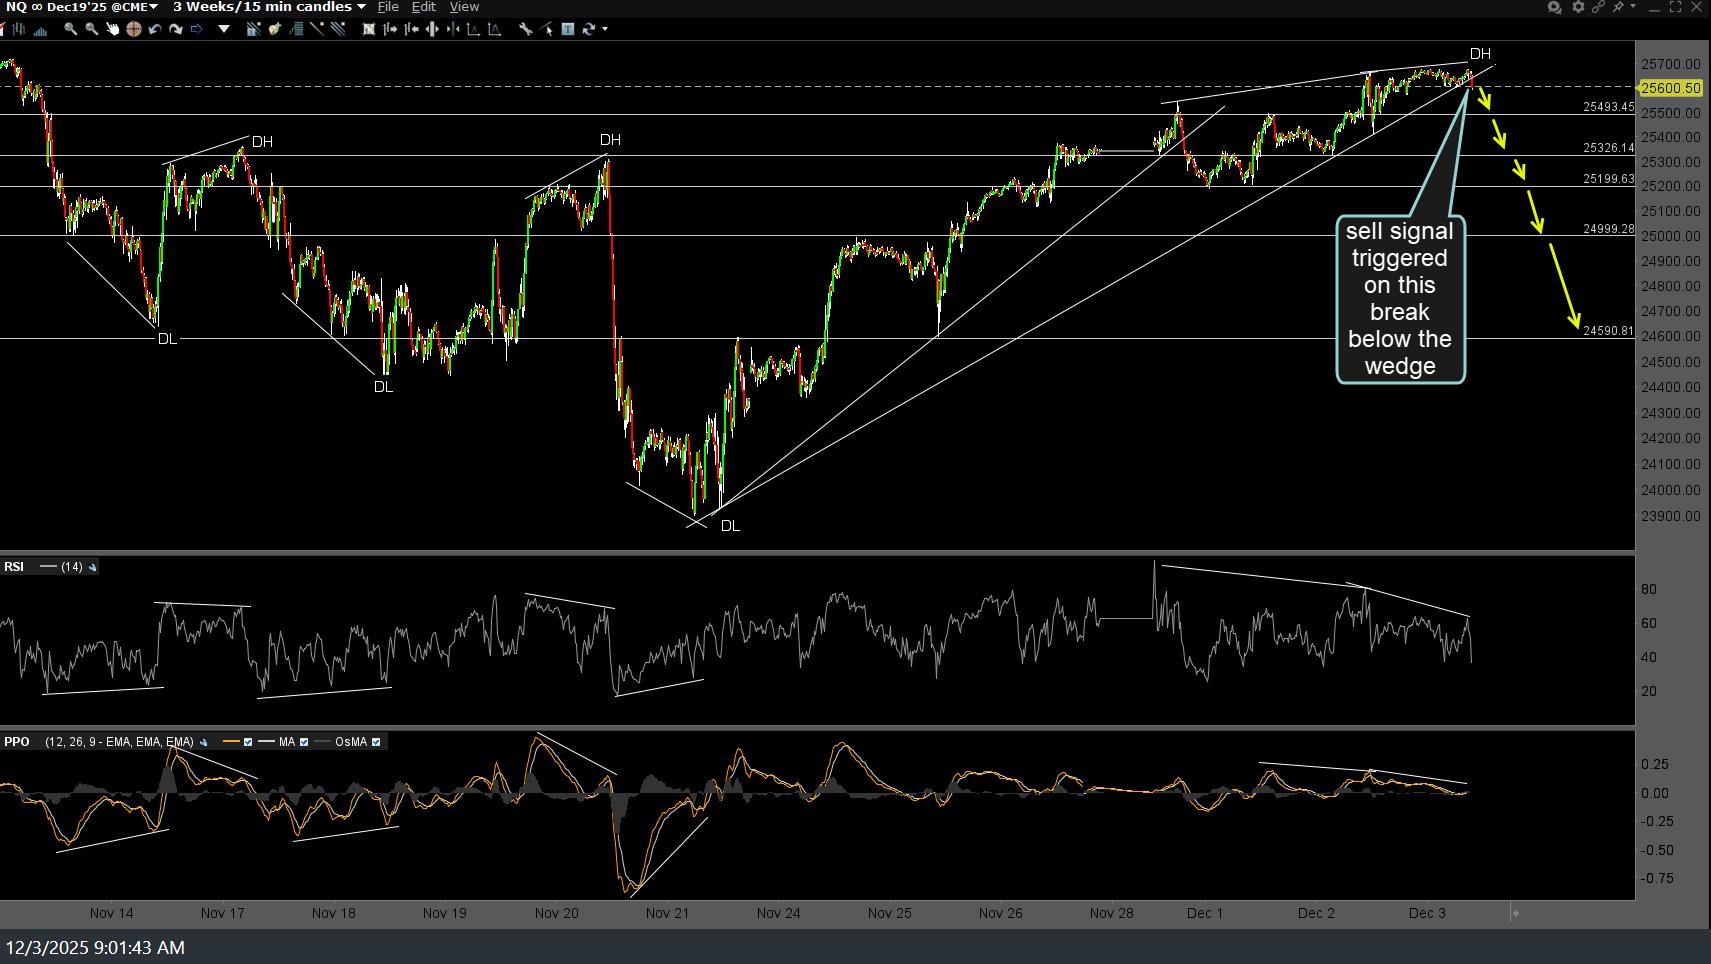
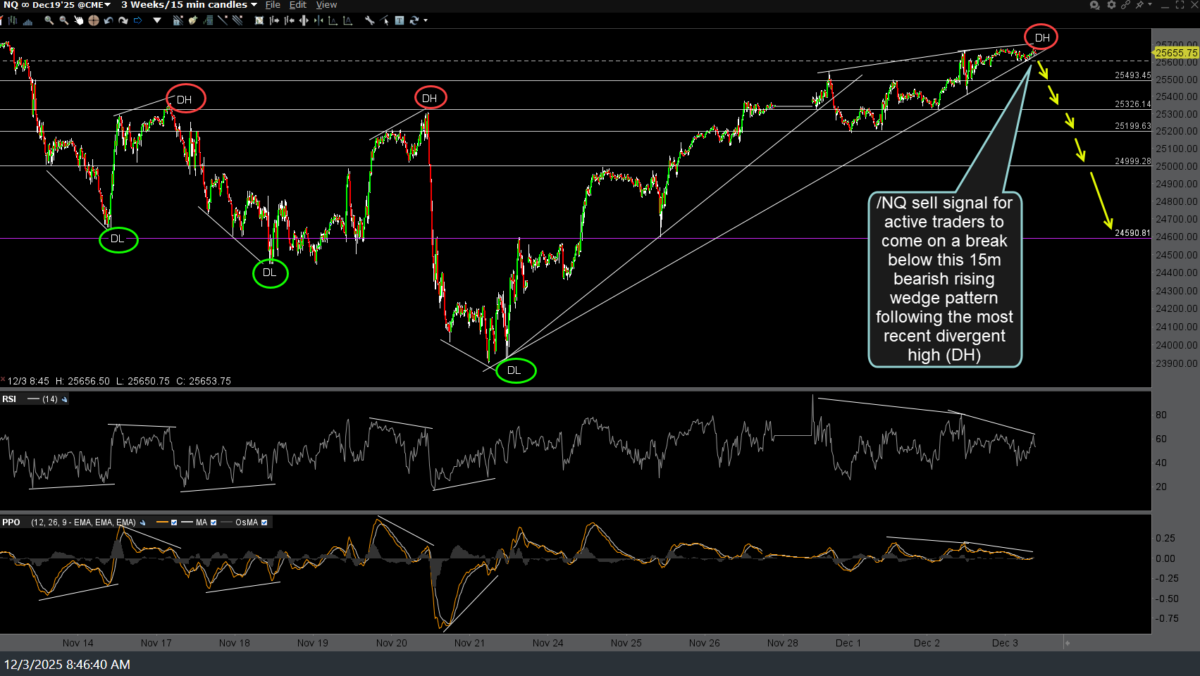
So far, we had the typical & minor reaction off the first price target on the 15-minute chart following yesterday’s sell signal on the trendline break, with the next sell signal to come on a solid break below this 25,600ish minor support. Updated (first) followed by the previous 5-minute charts from yesterday, below.
NQ 15m Dec 4th
NQ-15m-3-Dec-3rd
NQ-15m-2-Dec-3rd
NQ 15m Dec 3rd
Should /NQ hit the 4th & final target on this short-term, 15-minute chart, that would sharply increase the odds that T2 on the recent swing trade based off the daily chart of QQQ will be hit as well. Previous (Oct 8th & Nov 1oth) & updated daily charts of QQQ below.
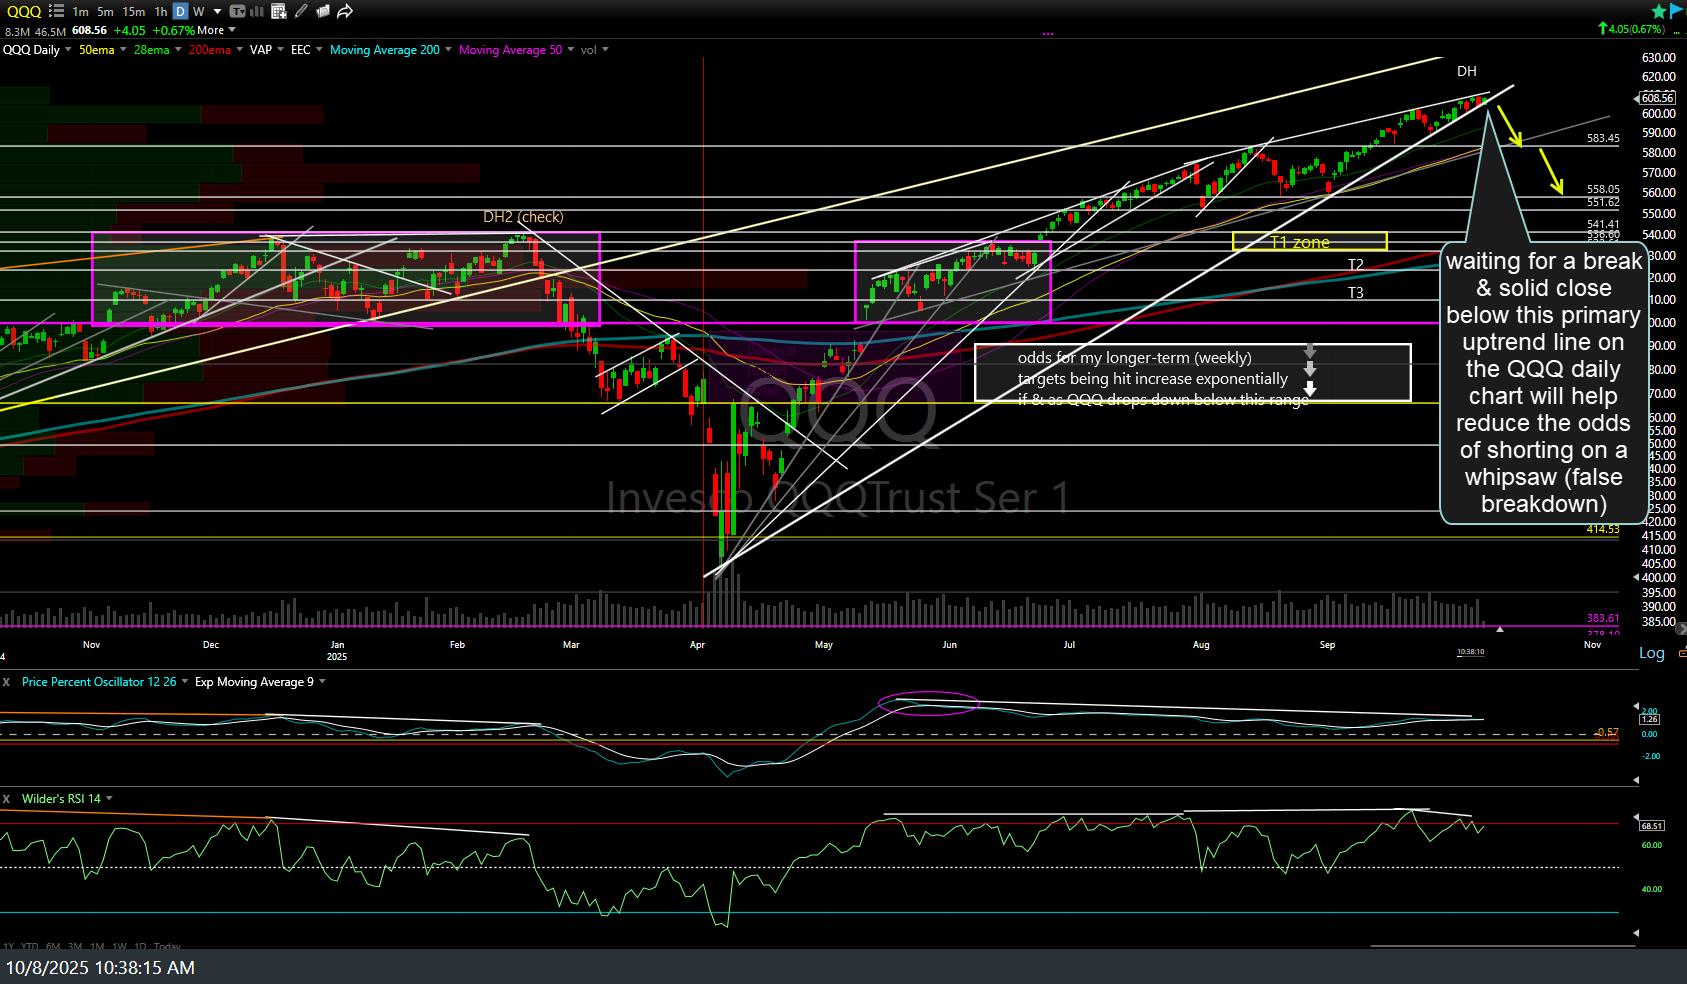
QQQ-daily-Oct-8th

QQQ daily Nov 10th
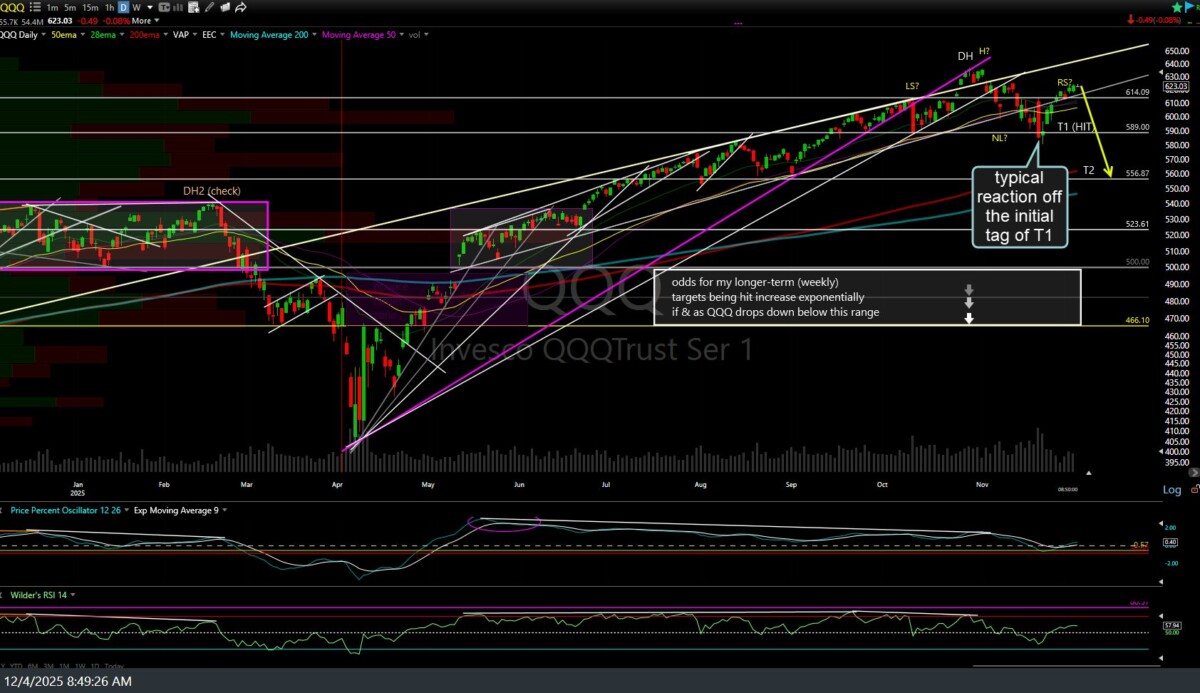
QQQ daily Dec 4th