
As highlighted recently, as well as many times over the past several months, the most significant support levels for the Nasdaq 100 and the S&P 500 now that the recent trading ranges have clearly broken to the downside are the key 200-day moving averages which were tested yesterday & are currently being tested again today. As I shared yesterday, I suspect we’ll get a tradable bounce off the 200’s, followed by another major leg down that clearly takes them out & sends the major indices down to my next long-term swing/trend targets. While that could happen today, tomorrow, weeks, or even months from now, the important thing is to recognize & react accordingly.

QQQ daily March 5th
In order to spark a rally that triggers a tradable bounce (5-7% to max. targets, if hit), we need to first break out above the following near-term levels on the 5-minute charts of /NQ & QQQ posted below.

NQ 5m March 5th
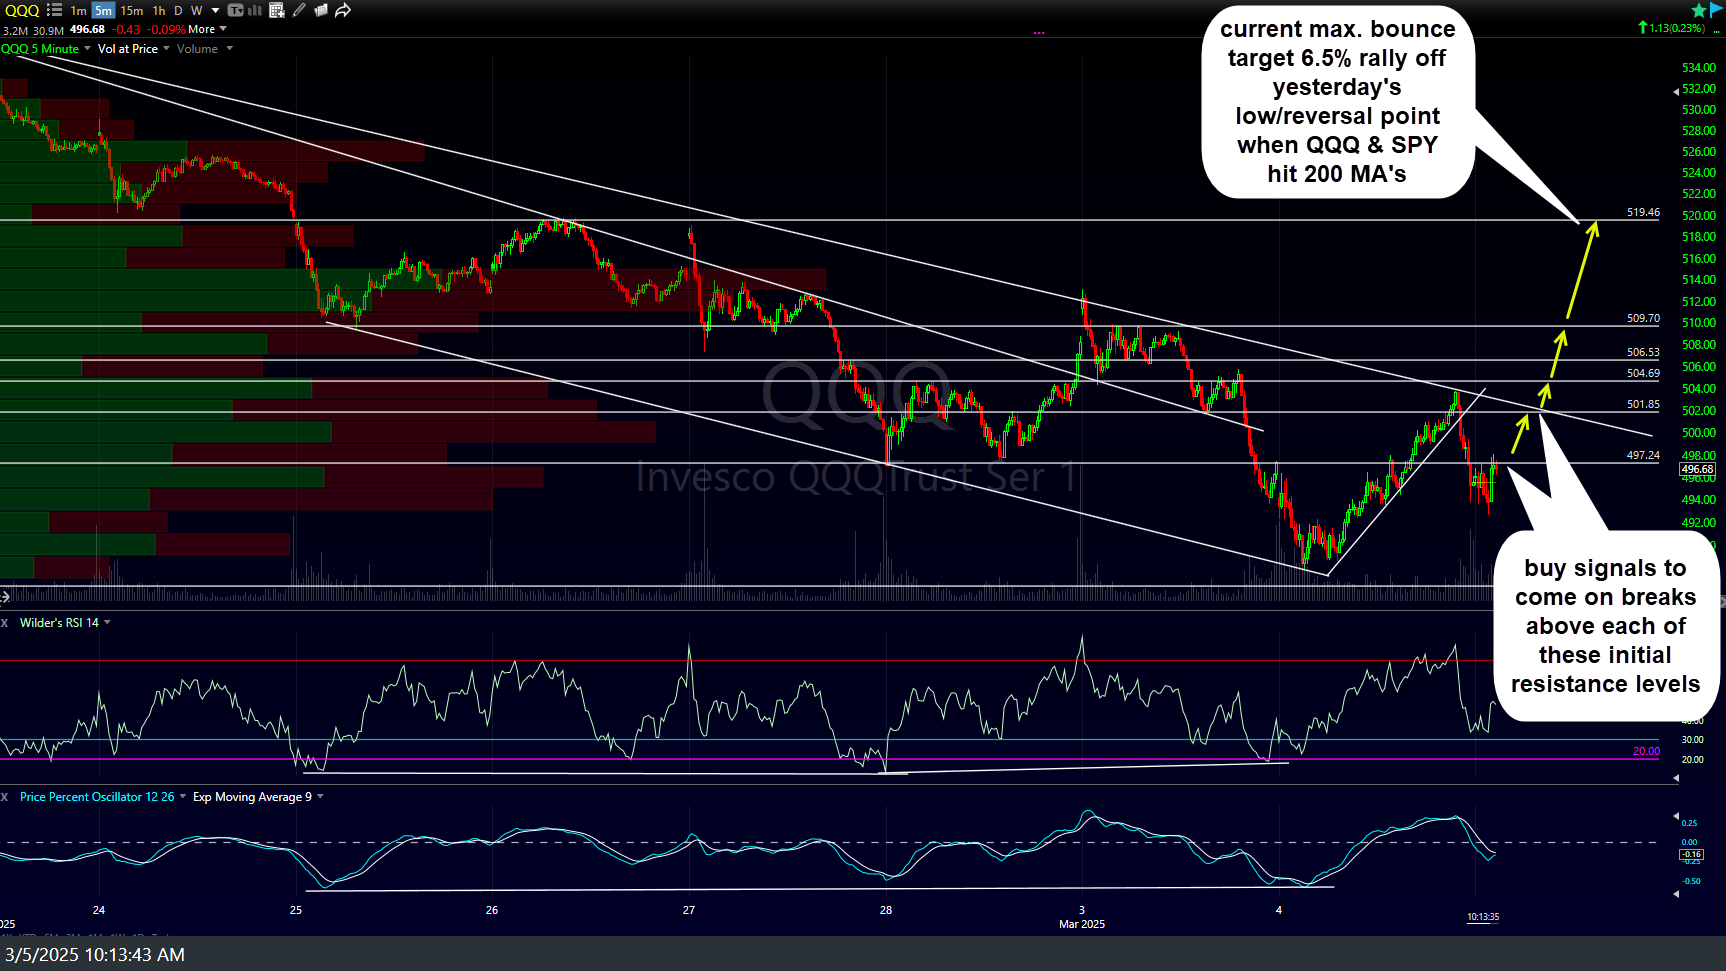
QQQ 5m March 5th
Of course, the 5-minute intraday charts are the realm of the active trader. Typical swing & trend traders, even longer-term investors, should be more concerned with the developments on the daily & weekly charts.