
I’ve added a minor support on that QQQ 15-minute chart at 353.96 which coincides with the uptrend line on that 15-minute chart of /NQ posted earlier with the next sell signal/objective add-on to come on a break below it. Previous & updated 15-minute charts of QQQ below.
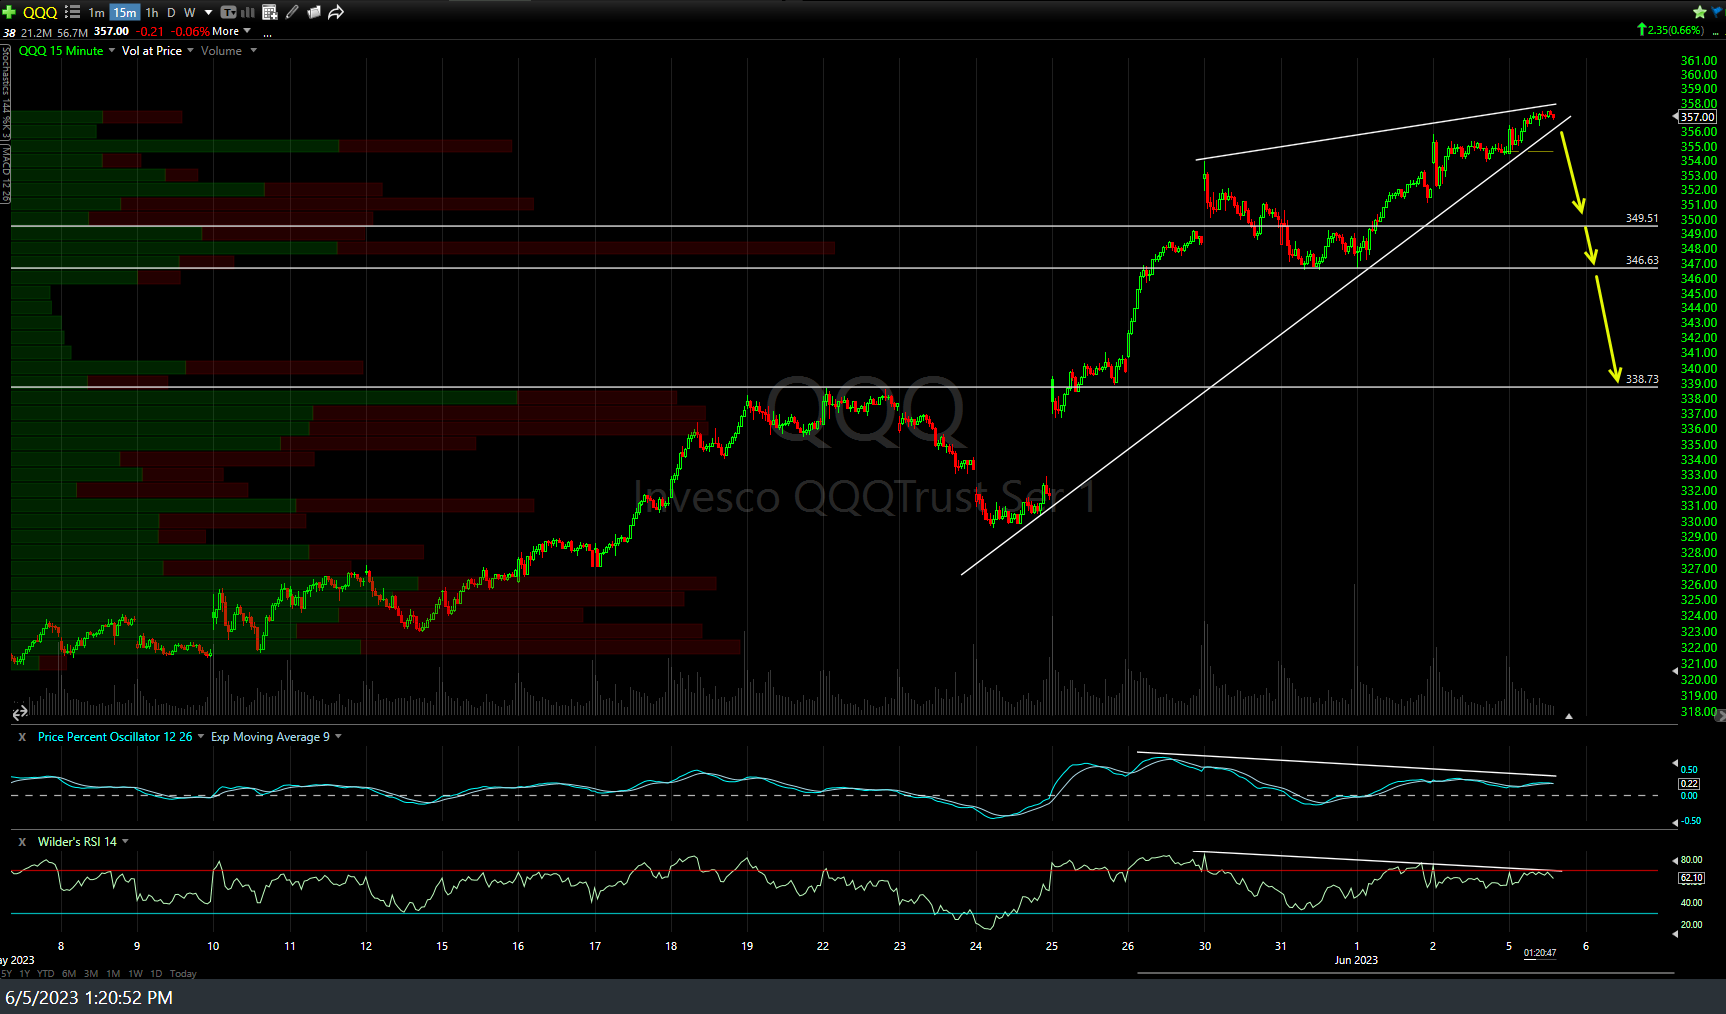
QQQ 15m June 5th
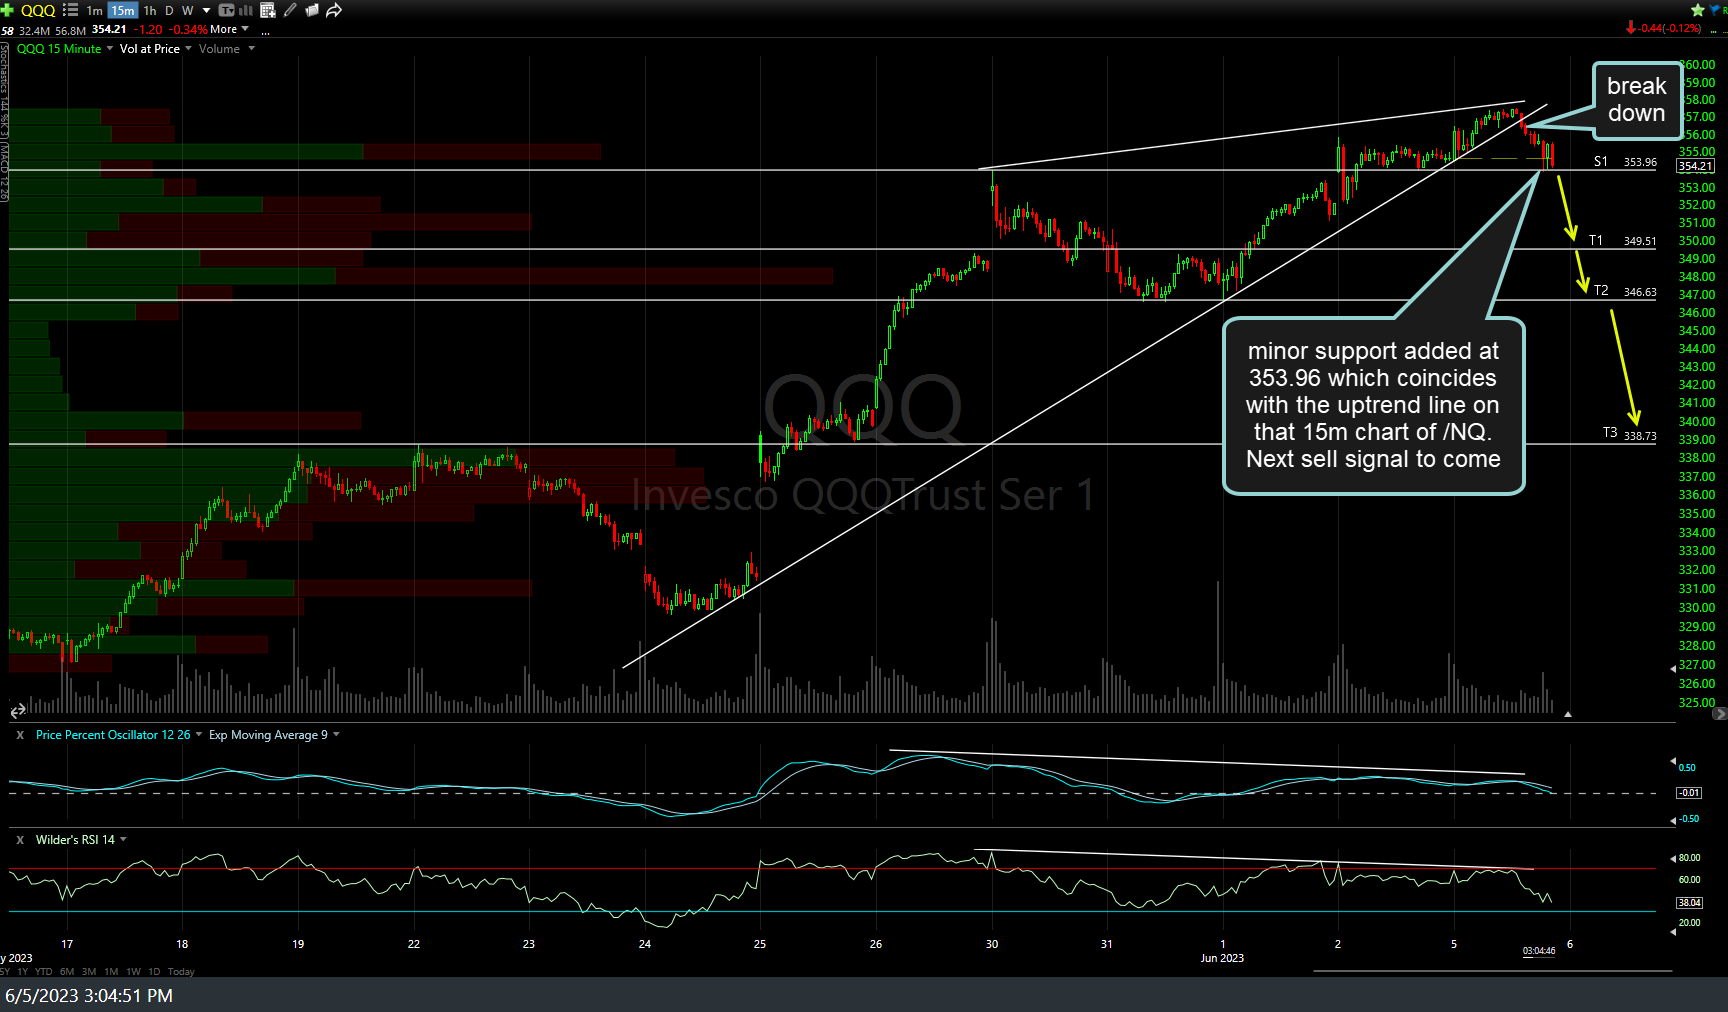
QQQ 15m 2 June 5th
…and here’s the updated 15-minute chart of /NQ which is testing that uptrend line with the next sell signal/add-on to come on a break below today’s low (uptrend line). Dip buyers have been aggressively buying pullbacks to the earliest of support levels recently so & if when today’s lows (support) are taken out, that’s likely to trigger a cluster of stop-loss orders & usher in another leg down towards the first price targets.

NQ 15m 2 June 5th