
The yellow circles on this 15-minute chart of /NQ (Nasdaq 100 futures) show near-term buying climaxes & the blue circles selling climaxes, both of which are usually followed by a near-term trend reversal (pullback or rally).
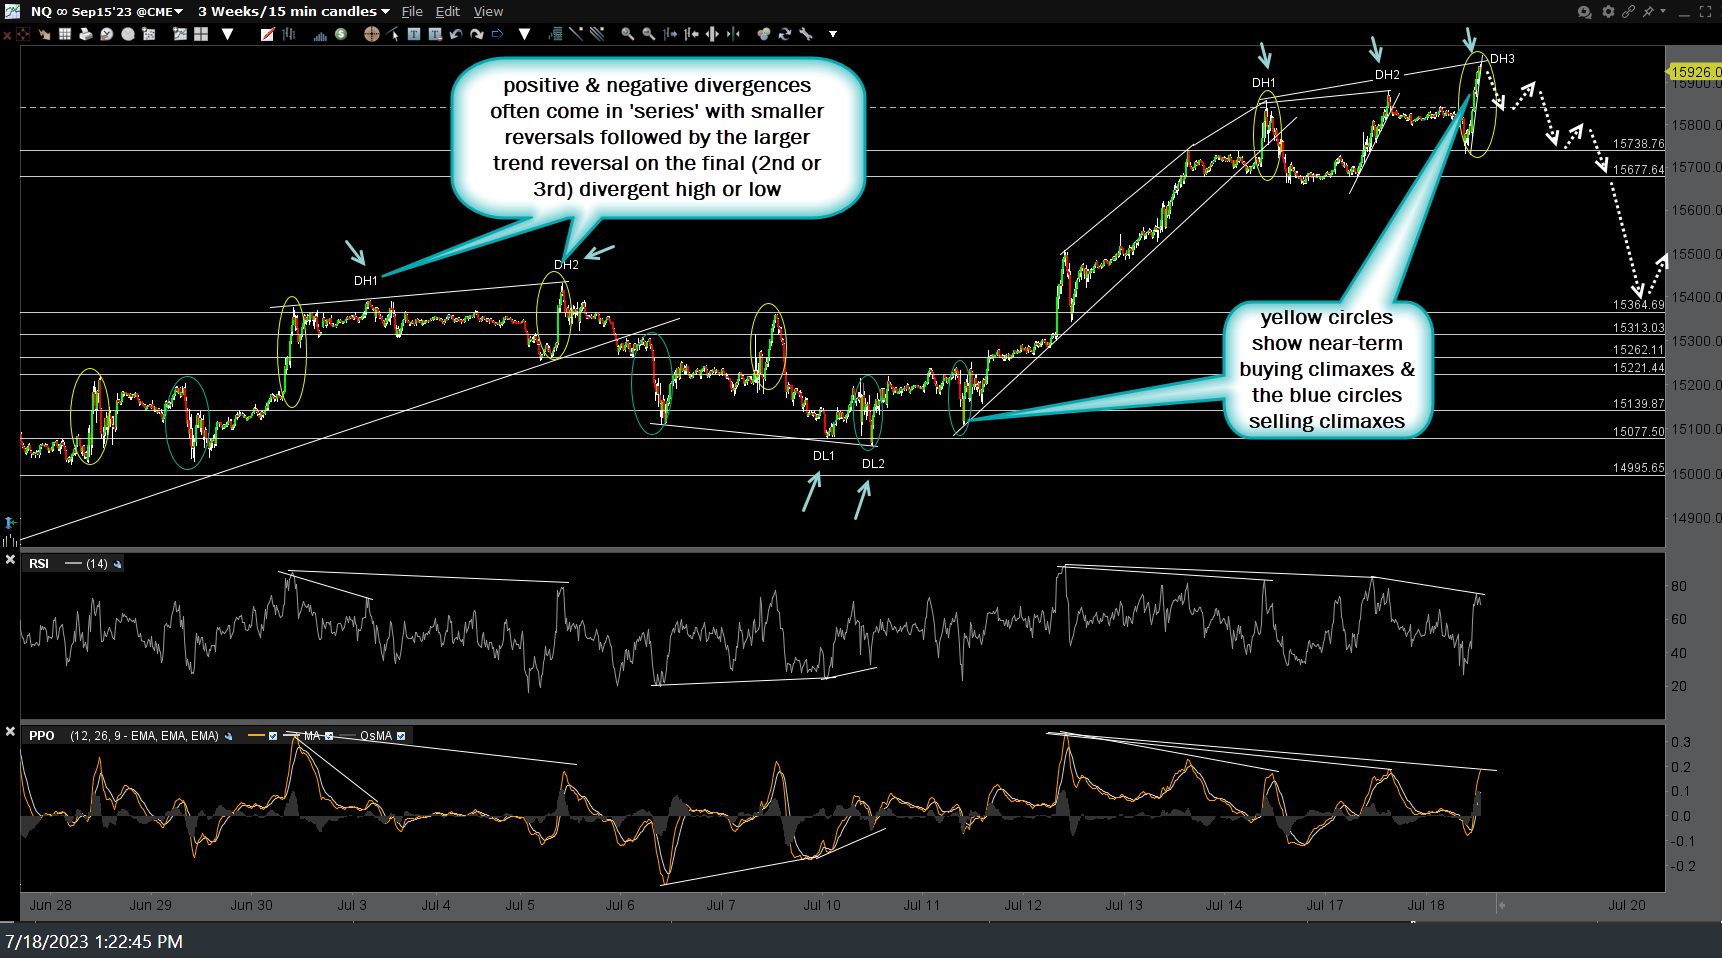
NQ 15m July 18th
Also highlighted above are how divergences, both positive (bullish) & negative (bearish) are typically formed in series with multiple consecutive smaller divergences (each followed by a relatively small reversal, typically commensurate to the scope of the divergence), finally culminating within one single larger divergent high or low followed by a larger & final trend reversal (correction or rally).
The current spike indicative of a near-term buying climax in /NQ & QQQ is still in play but if you zoom into that chart above closely, you will see a steep, nearly vertical uptrend line in which to trigger a sell signal (once broken) for active traders looking to game a pullback trade with a likely scenario of how the next pullback will pan out shown by the white dotted arrows. QQQ & /NQ 60-minute charts included below & keep in mind that trading becomes more difficult during peak-earnings (this week & next) as earnings from any of the outsized market-moving stocks has the potential to override the technicals, at least in the very near term.
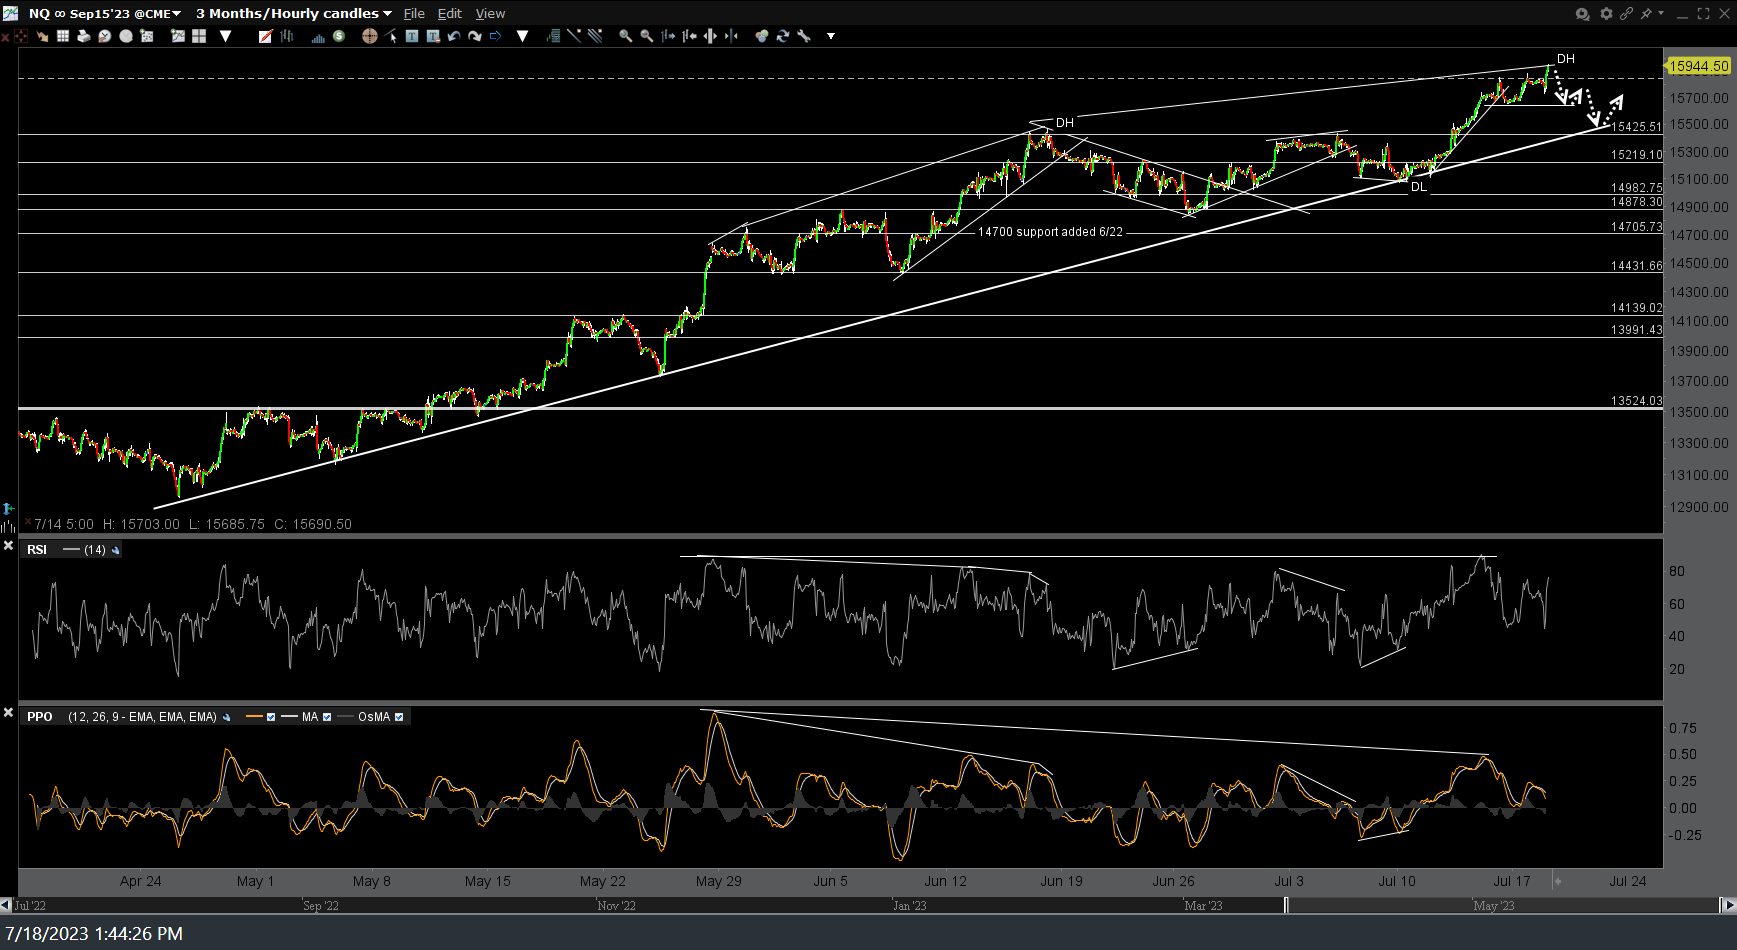
NQ 60m July 18th
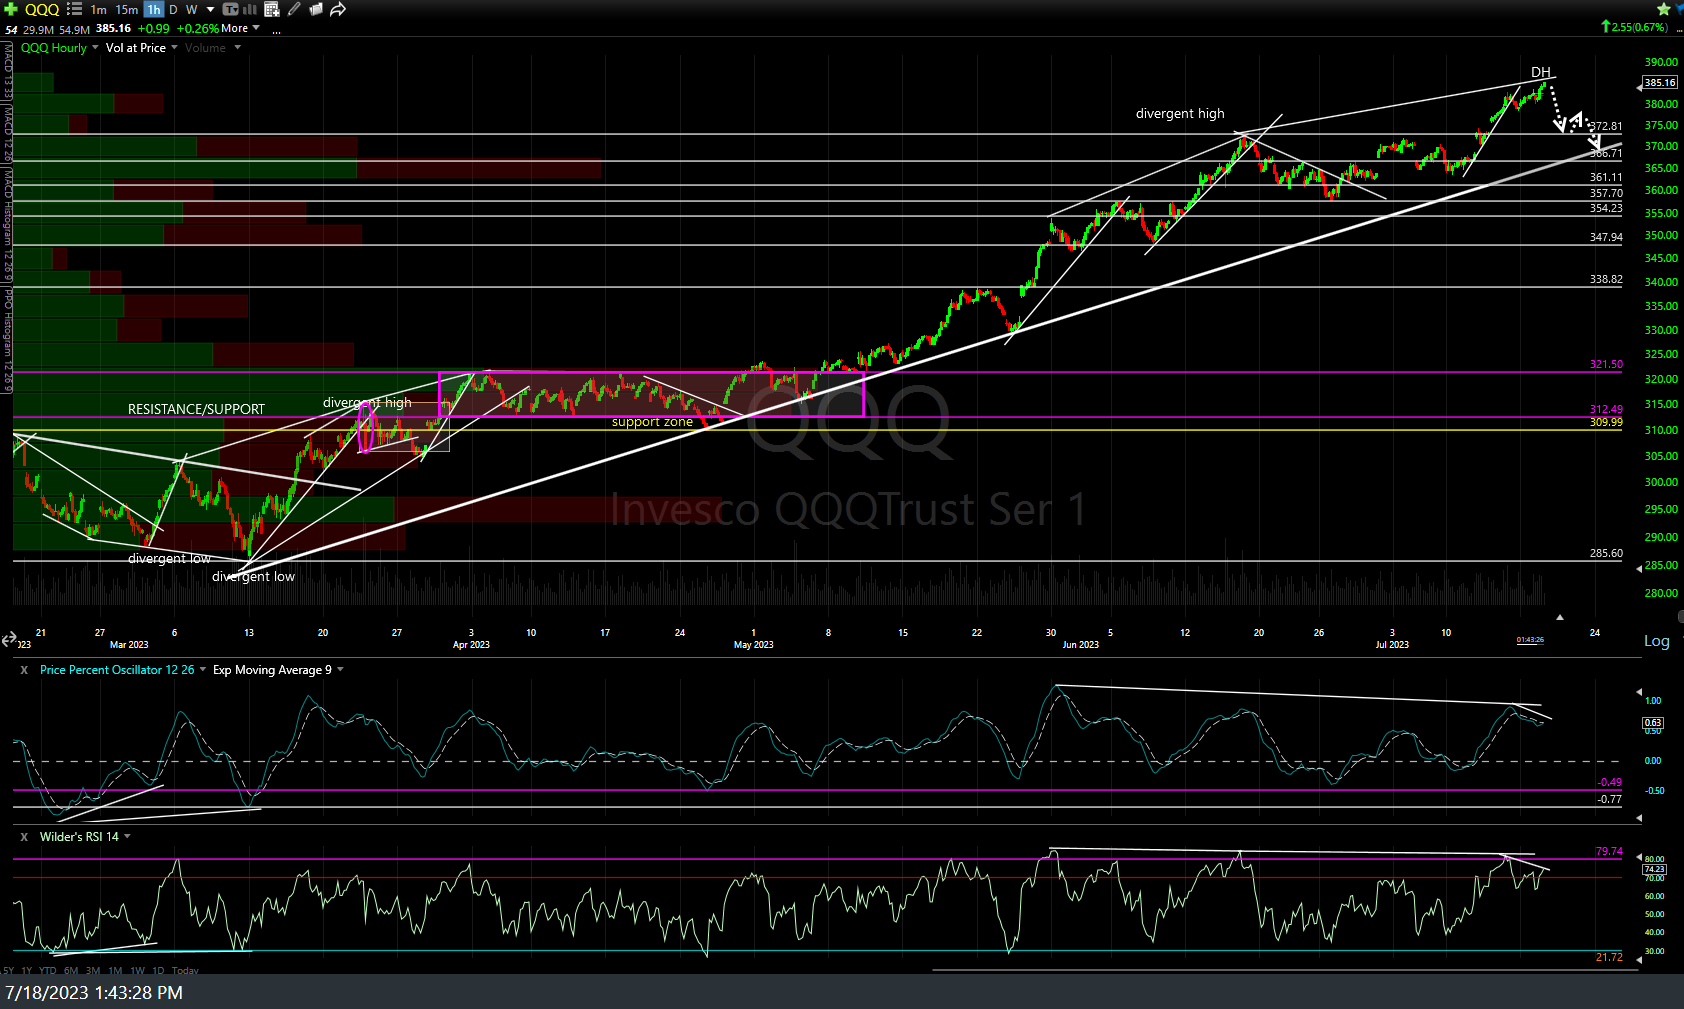
QQQ 60m July 18th