
Calling the play-by-play moves of the stock market with exact precision is a fool’s errand but that’s never stopped me before so call me a fool. Here’s my best guess for the remainder of today & into next week, FWIW. The 5-minute chart of /NQ below has the Nasdaq futures rallying up to minor resistance at 12182 which is likely to contain this minor bounce that coincided with QQQ going flat on the day. Should the market reverse & start moving lower in the upcoming final hour of the trading session, as I suspect, QQQ will go red on the day if/when /NQ takes out 12,114 & if that happens, I would expect the selling to accelerate as another red candle following yesterday’s massive red stick will likely (and should) shake out some bulls/longs.
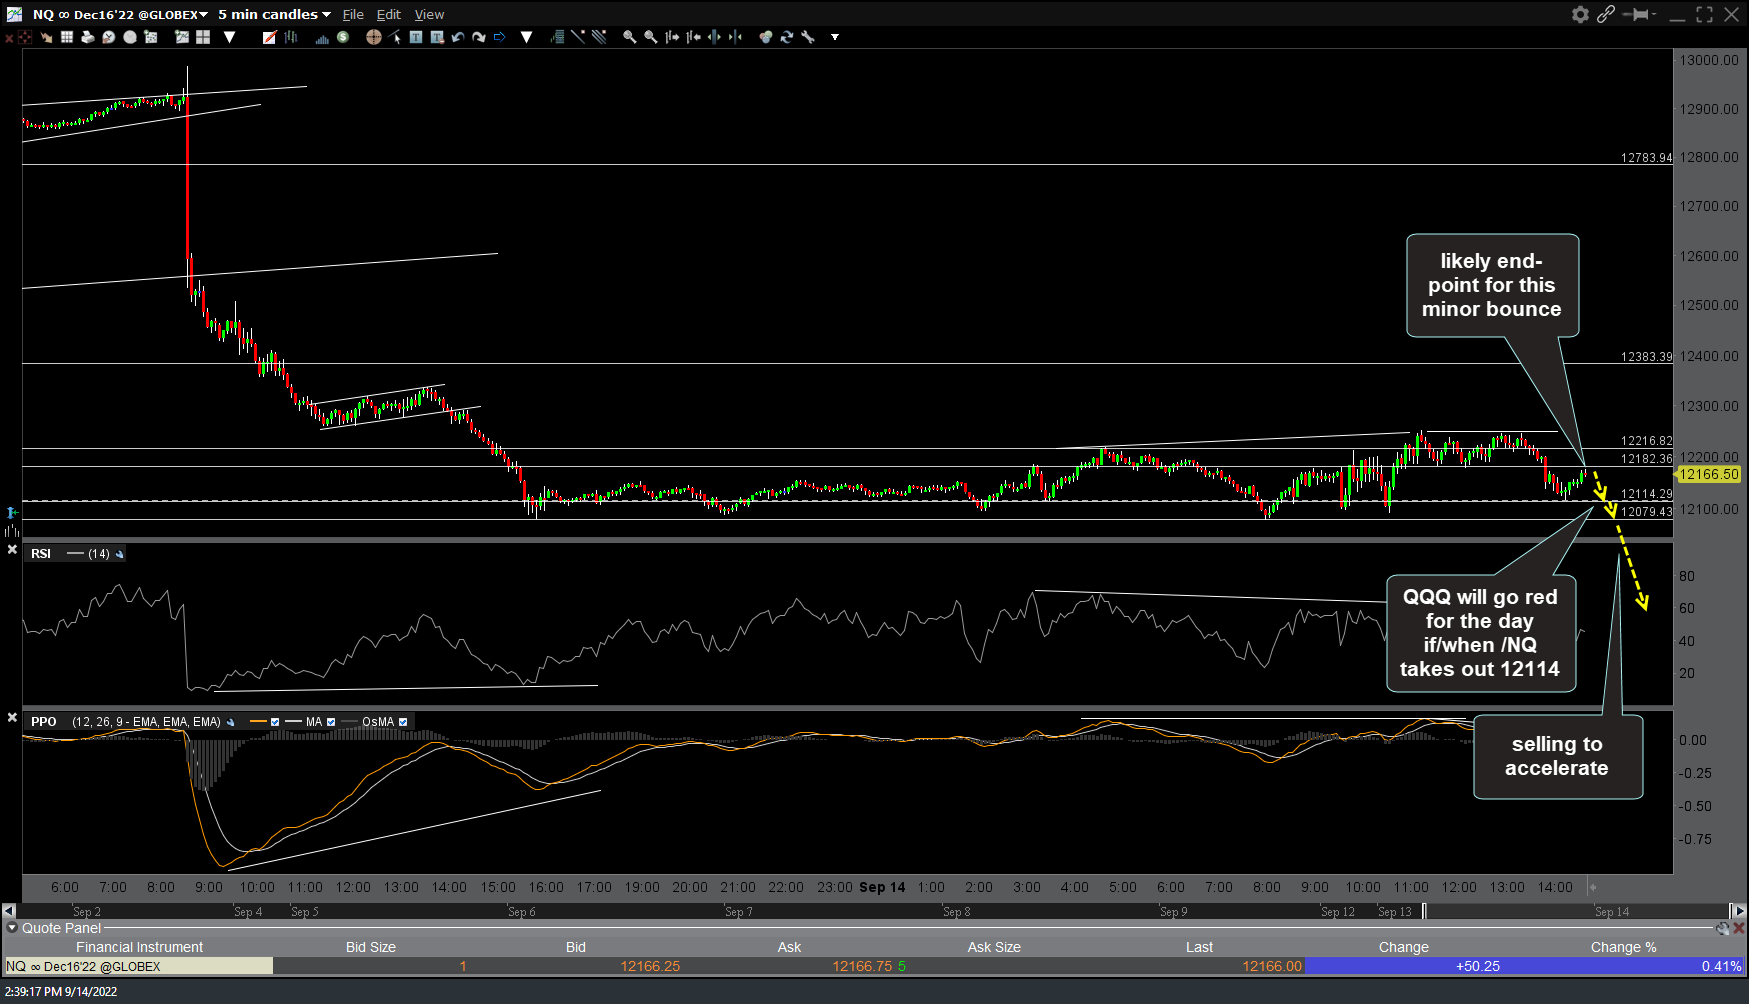
NQ 5m Sept 14th
No change from the 60-minute chart of QQQ that I posted earlier although this is an updated screenshot of that chart showing the Q’s once again testing that uptrend line that it’s been hugging for the past 2 days. The Q’s are likely on the verge of the next powerful wave of selling as longs/bulls create a stampede in a crowded rush for the exits before Wednesday’s FOMC rate hike with a sell signal still pending a solid break below the trendline & 290ish support. As always, JMHO so DYODD and trade according to your own trading plan, risk tolerance, & outlook for the market.

QQQ 60m 2 Sept 14th