

On the near-term time frame, I’m still awaiting & favoring a break above 19390 to trigger the next leg up to my 19660ish initial bounce target while that previous highlighted 19300 resistance has been capping /NQ since Friday. Previous (Friday) & updated 15-minute charts below.
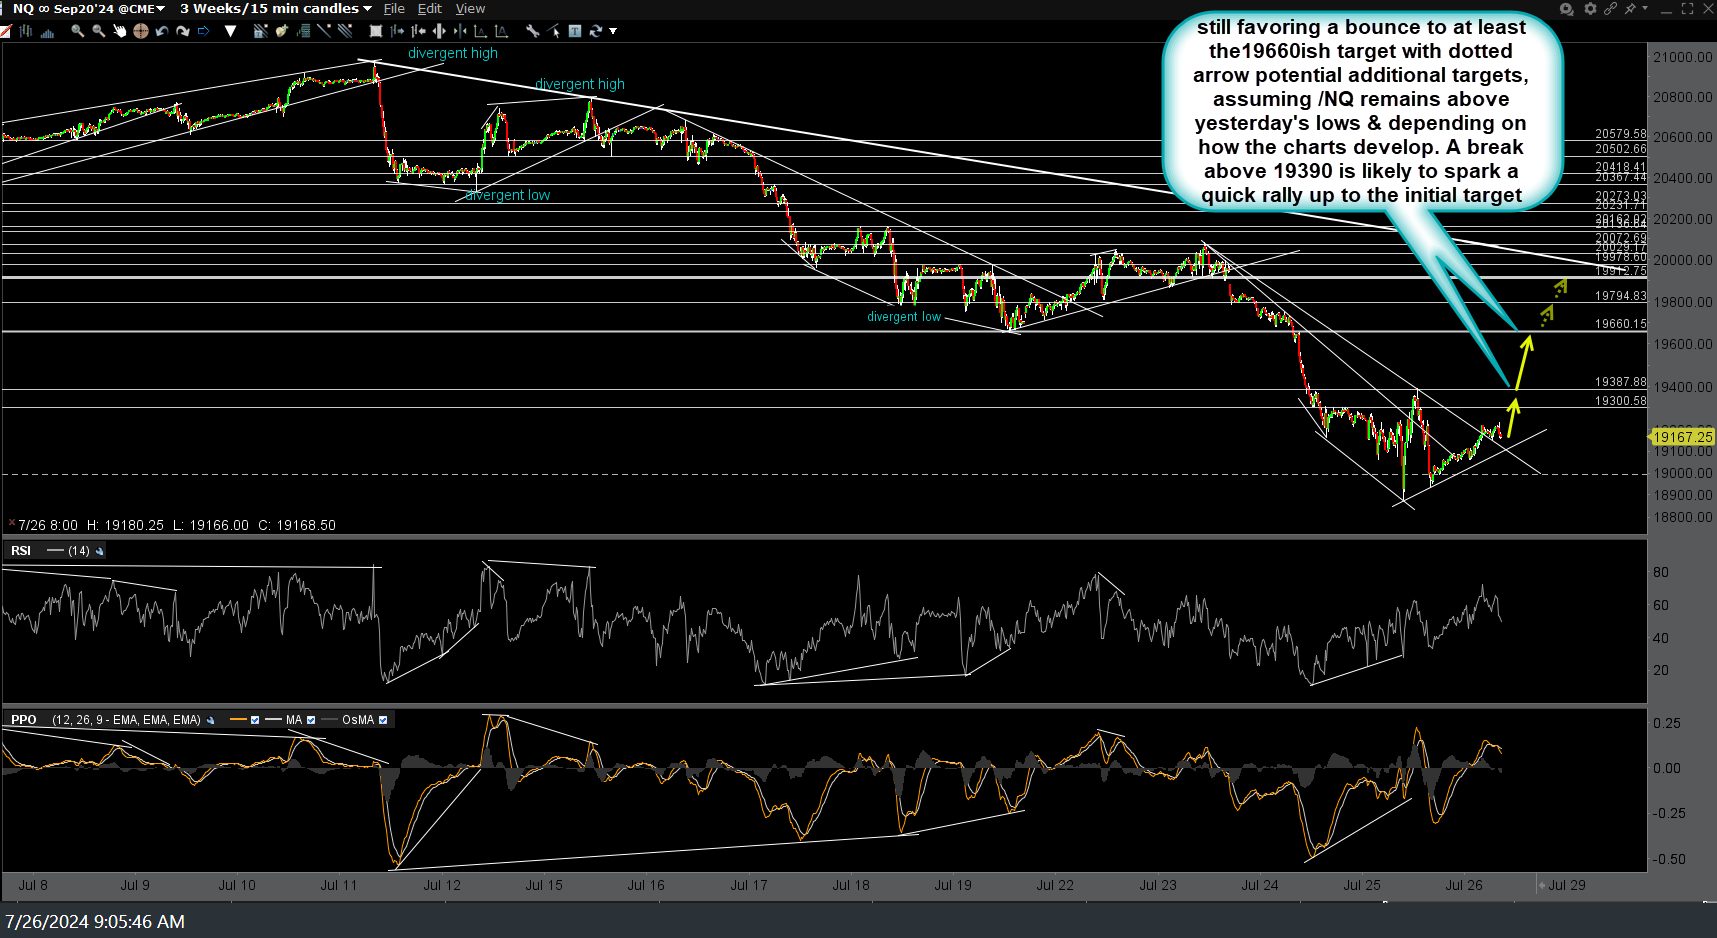
NQ 15m July 26th
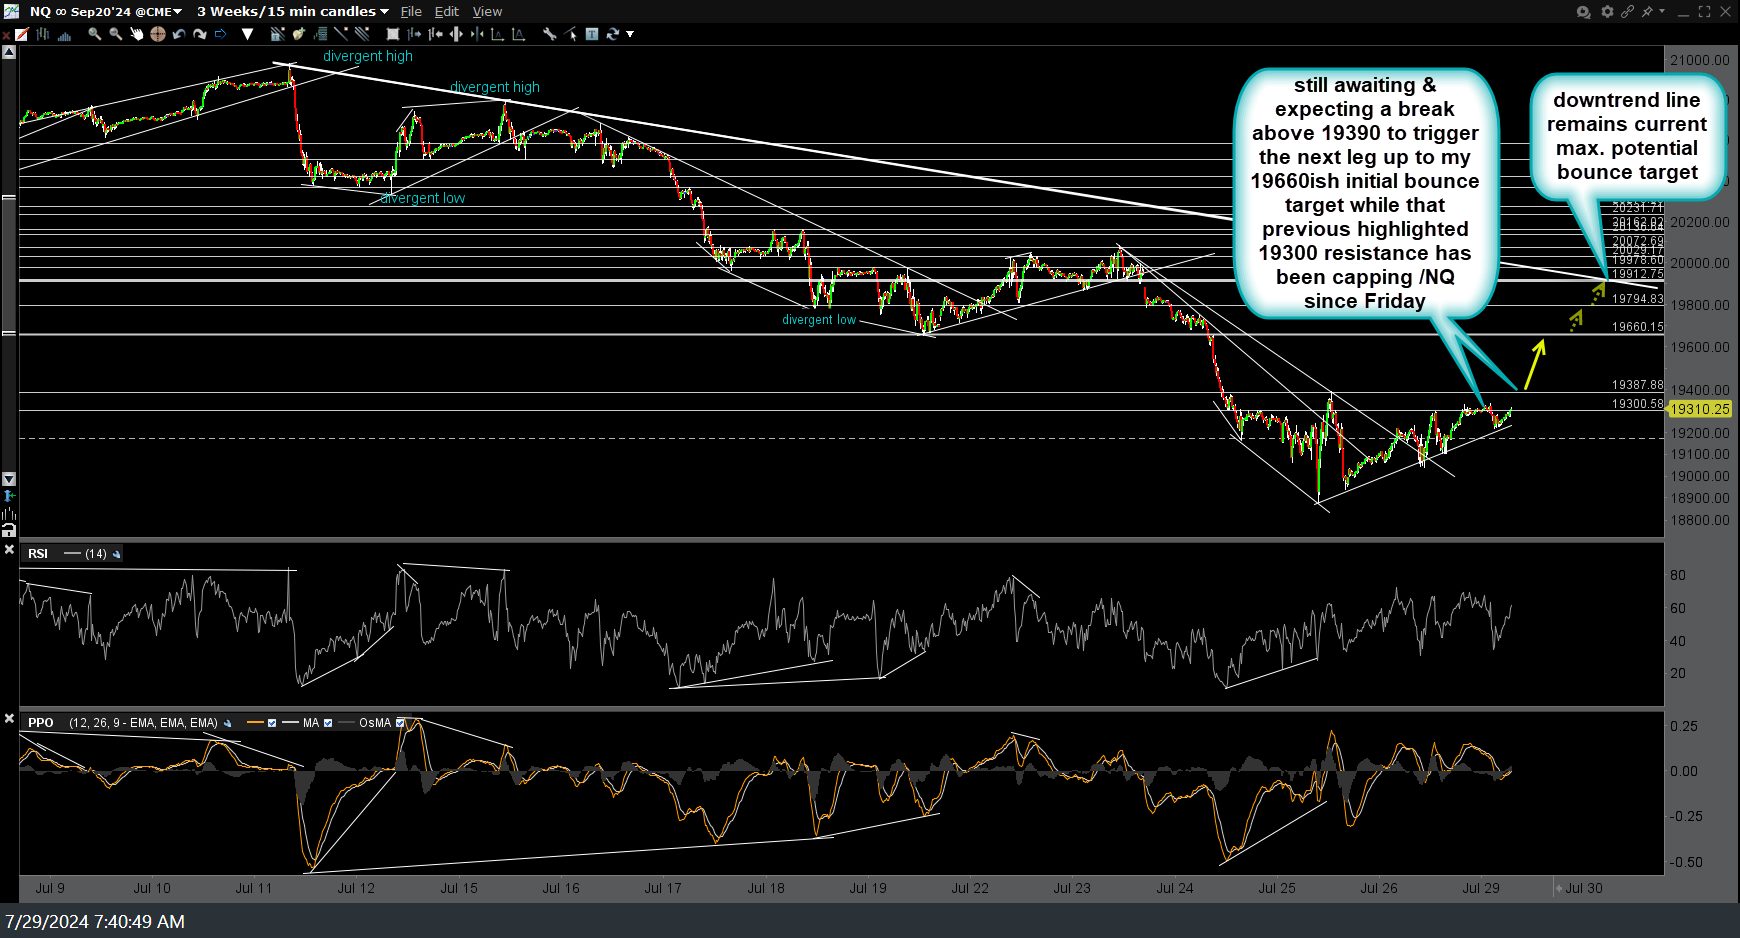
NQ 15m July 29th
Bigger picture (longer-term), I’ve added a new downside swing/trend target added to my /NQ daily chart around 18254, now T5 with the remaining targets resequenced. Previous & updated daily charts of /NQ.

NQ daily July 10th

NQ daily July 25th
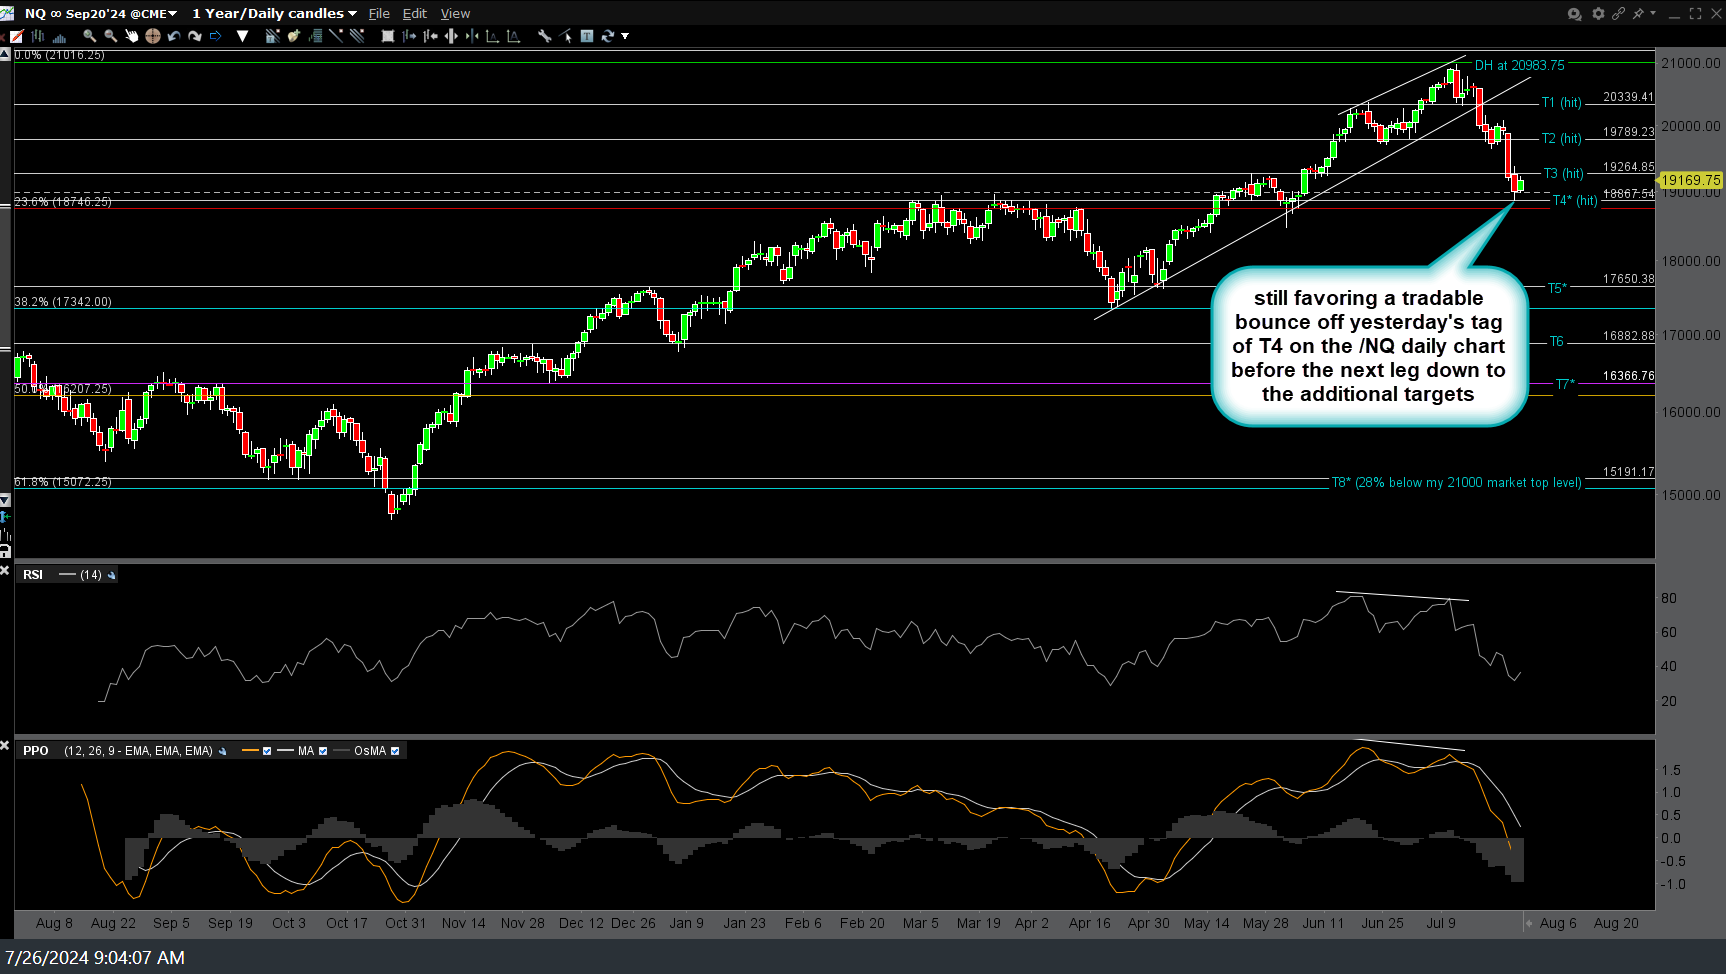
NQ daily July 26th
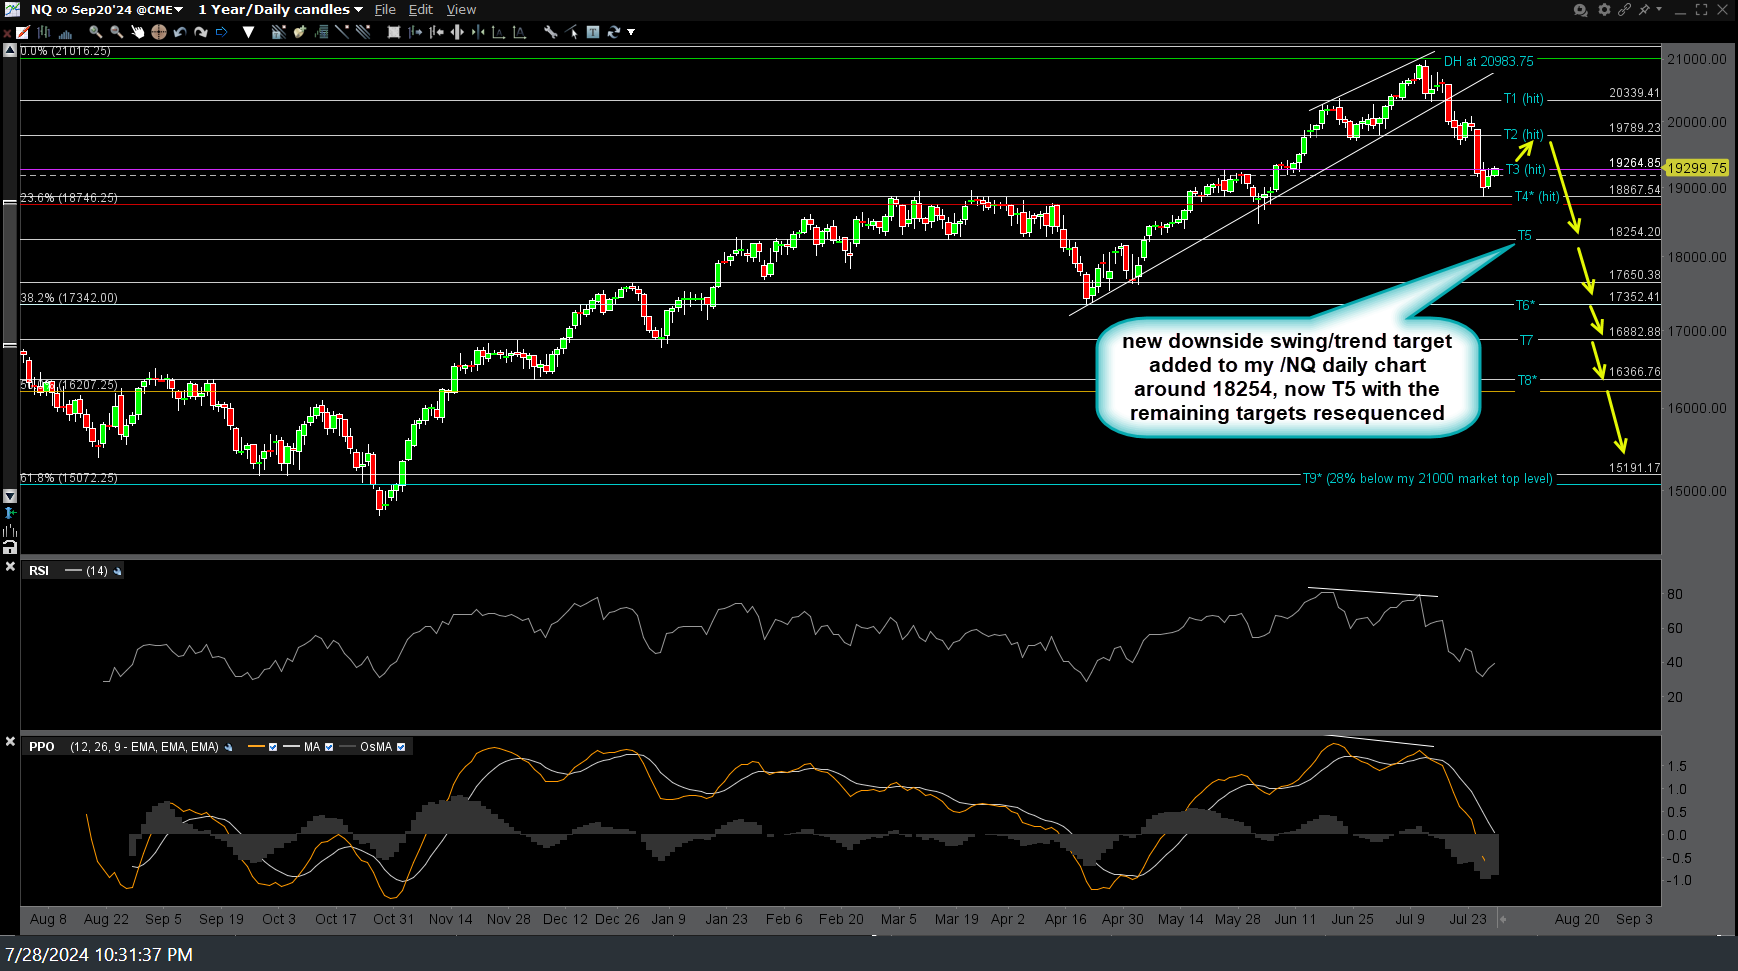
NQ daily July 28
The comparable minimum preferred bounce target for QQQ remains just below the 471.90ish resistance (see 15-minute charts from last week). I see a few requests for updates on nat gas, grains, etc.. & will follow up with those charts asap.