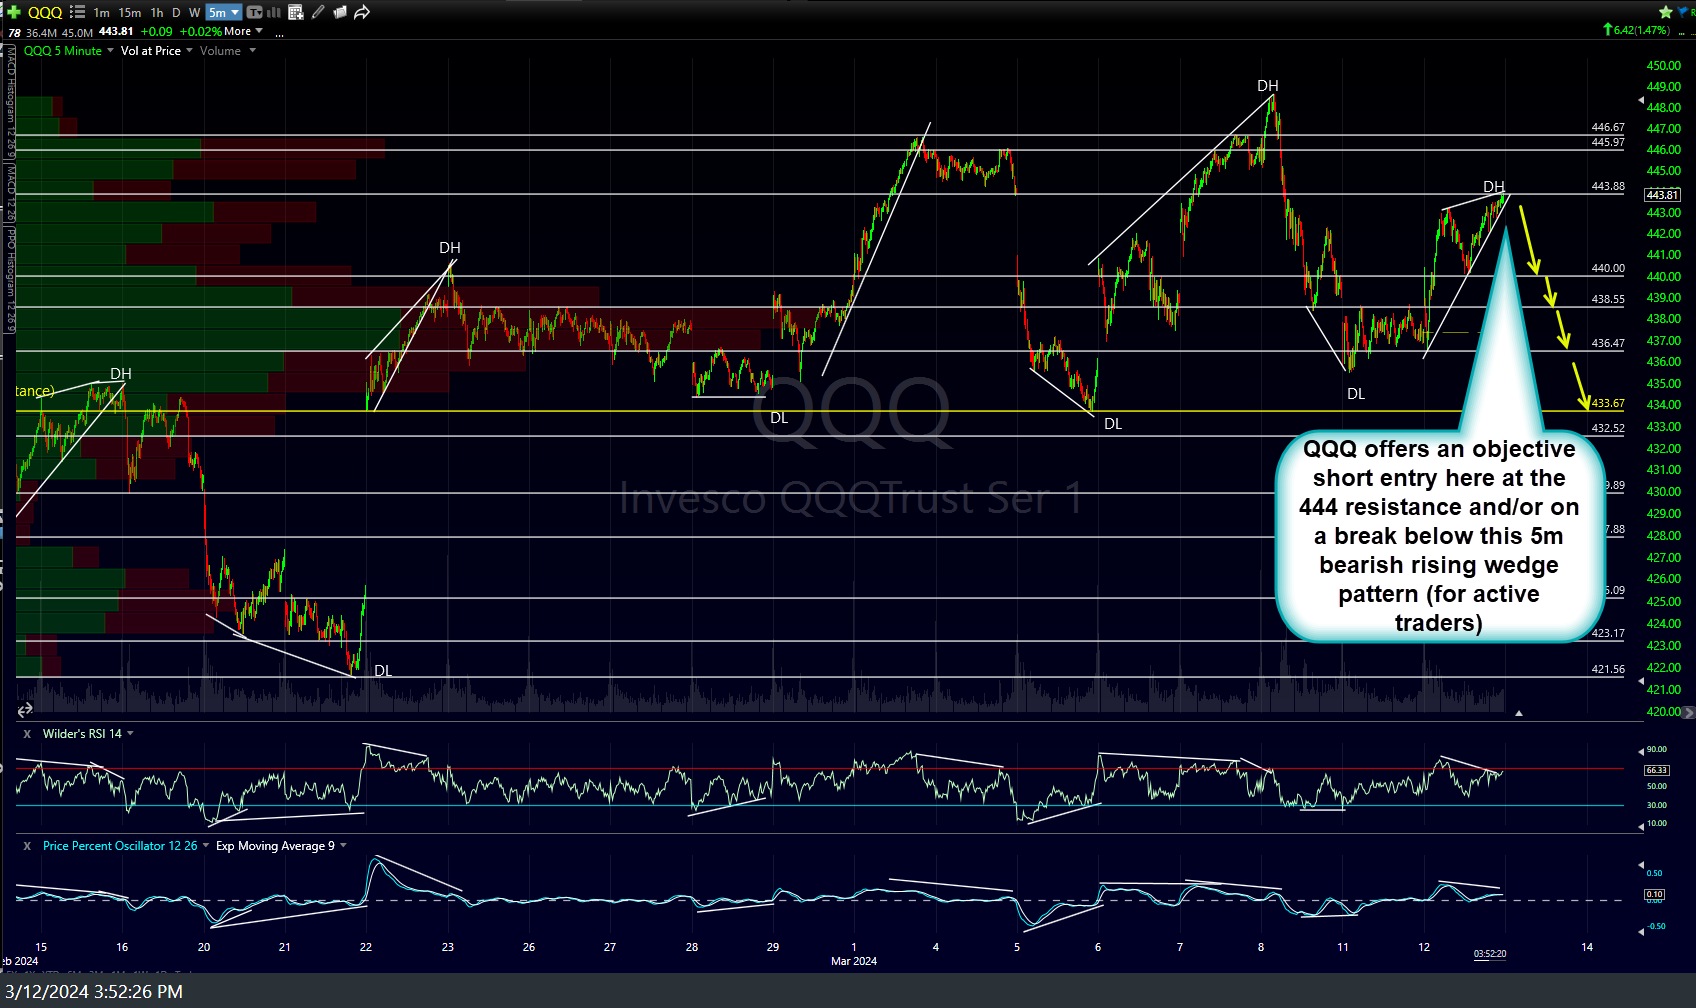
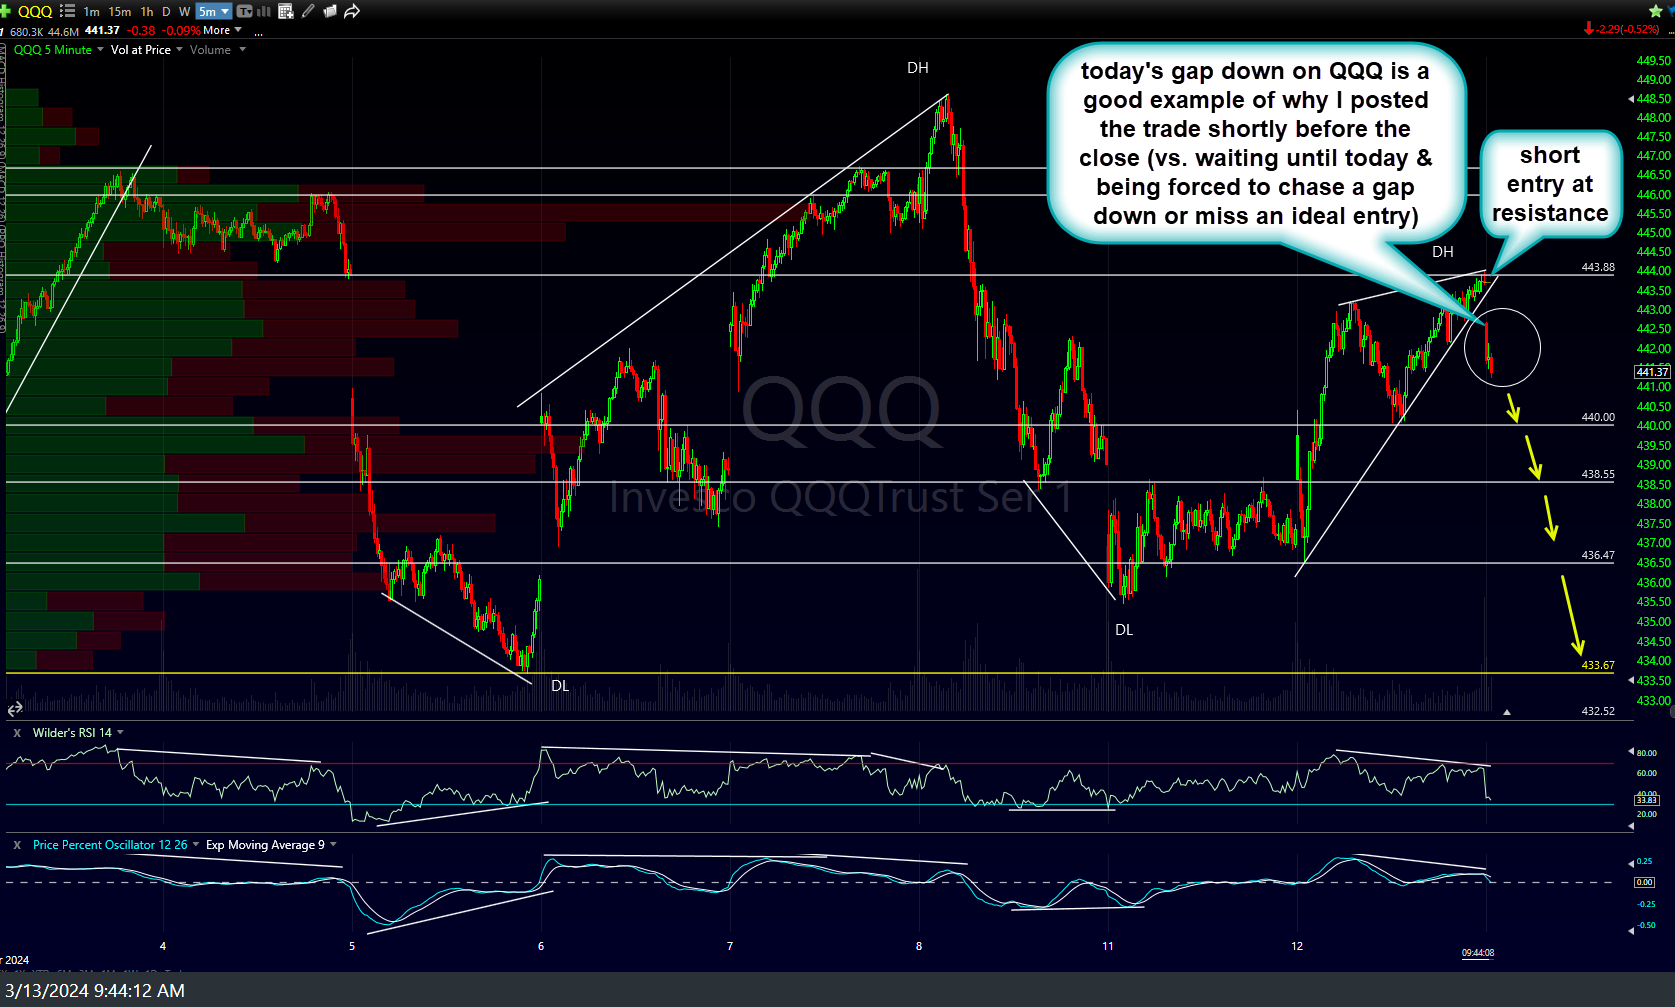
QQQ gapped down below the 5-minute bearish rising wedge pattern with today’s gap down being a good example of why I posted the trade shortly before the close with an entry at resistance (vs. waiting until today & being forced to chase a gap down or miss an ideal entry) within a fully formed bearish rising wedge pattern that appeared ripe for a breakdown. Previous & updated 5-minute charts below.
In the comment sector below yesterday’s post, I followed up to clarify that it was actually a 15-minute chart of /NQ that I posted in the first comment below that post. Here’s that updated 15-minute chart with potential targets for futures traders (/MNQ has the same chart/price levels but just uses a smaller multiplier/leverage factor).
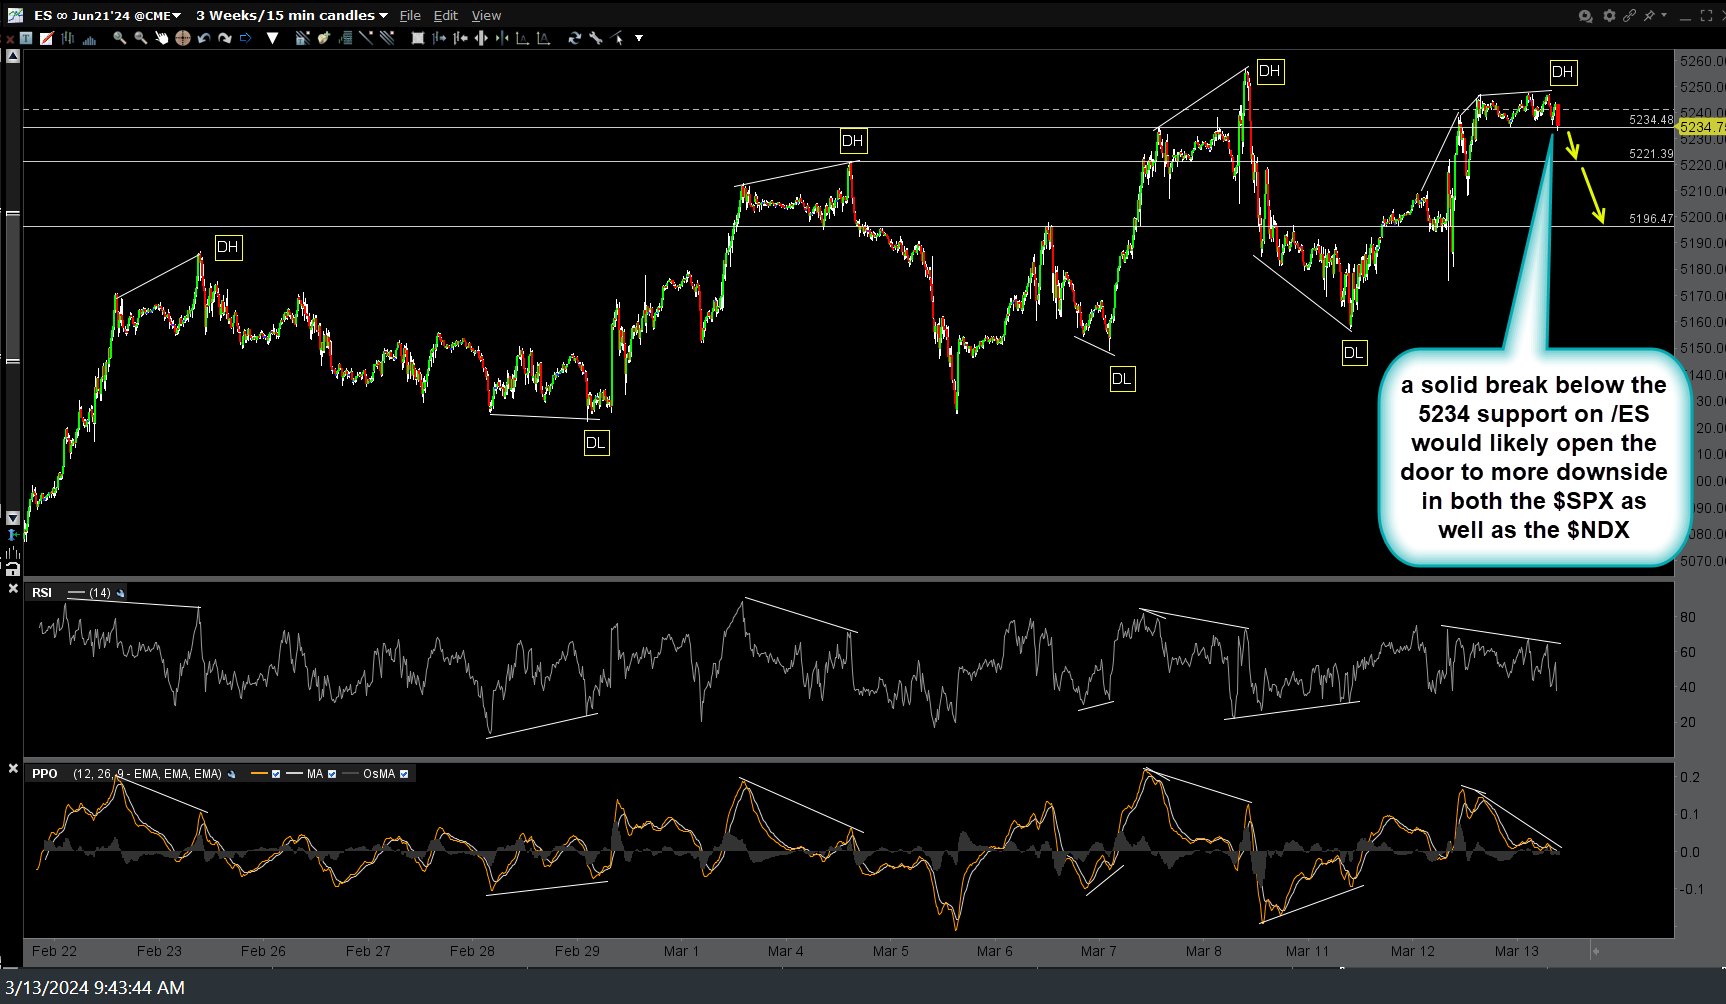
Here’s a 15-minute chart of /ES (S&P 500 futures) for reference or those that prefer trading it over the Nasdaq 100 (or just want to watch it for additional clues on where the market is likely headed). A solid break below the 5234 support on /ES would likely open the door to more downside in both the $SPX as well as the $NDX.
It’s also worth nothing that crude oil & gasoline futures are rallying (again) today while IEF (10-yr Treasury) has fallen back to the top of the yellow zone (support) with a solid drop back inside that range likely to be net bearish for the stock market.


