Back from dinner but late here with an early flight out back to the States tomorrow morning so last update for the day.
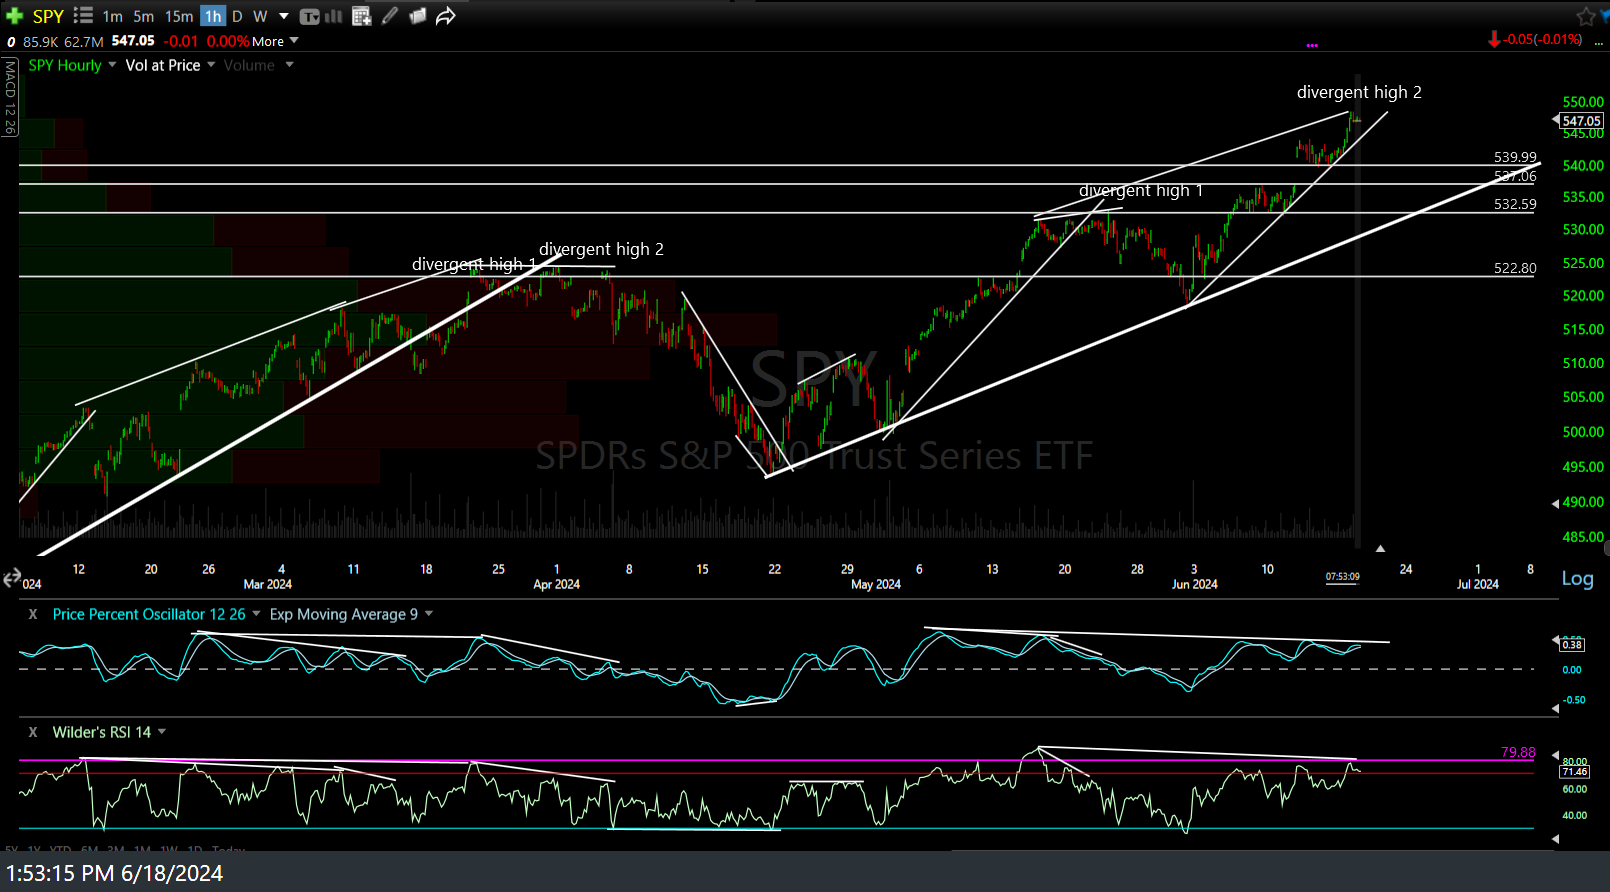
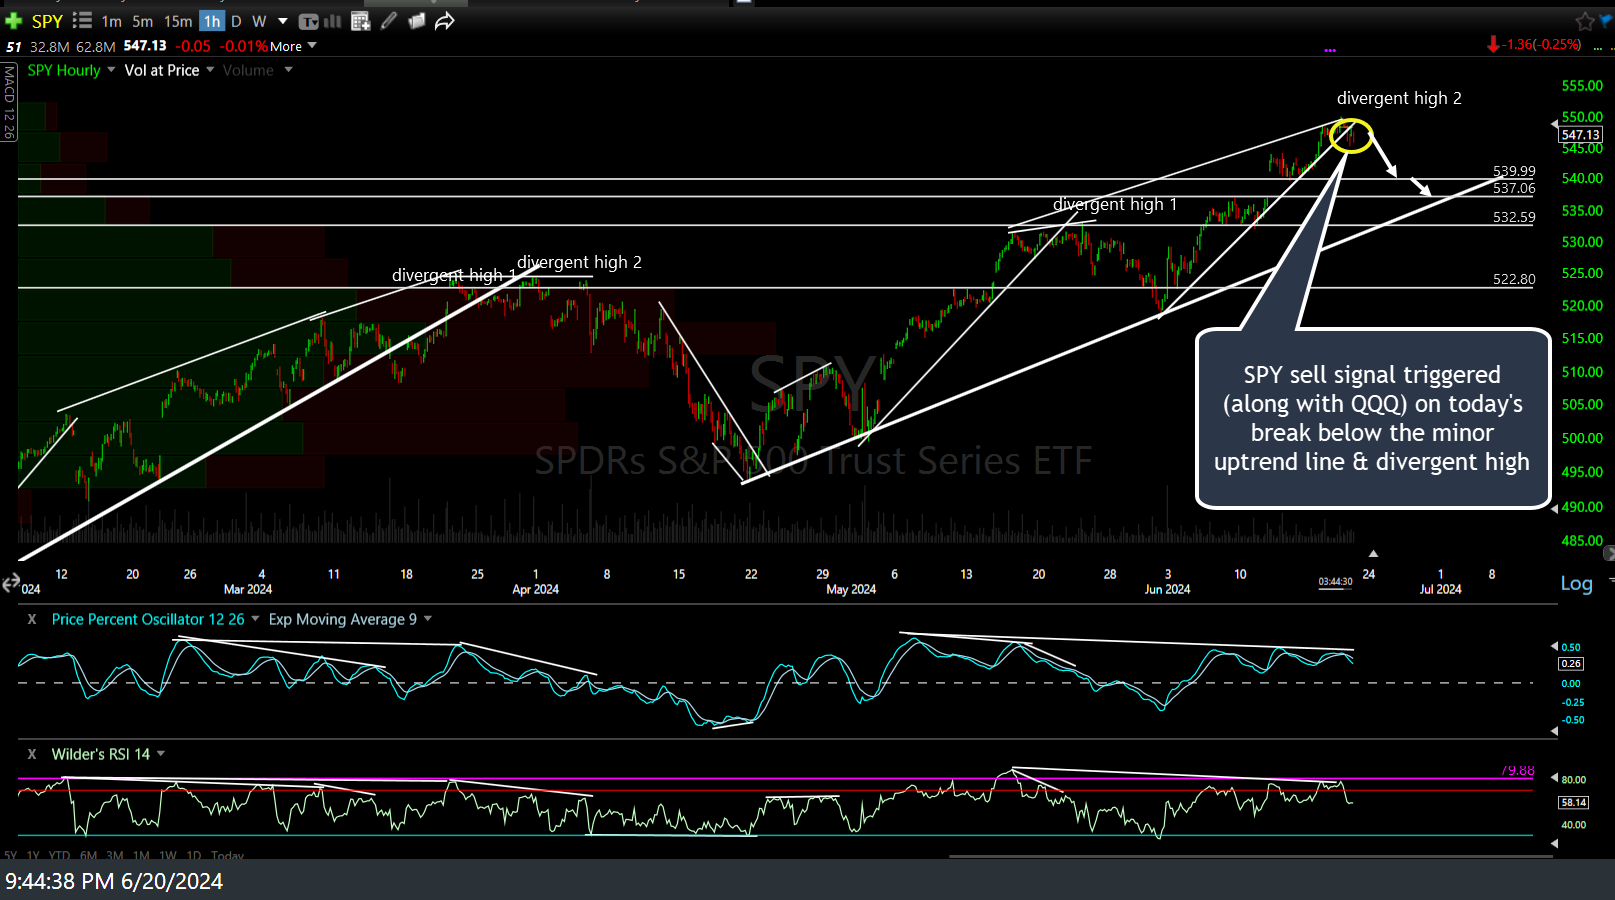
In addition to the minor trendline break/sell signal posted on QQQ earlier today, SPY also broke down below its comparable minor uptrend line today as well. Previous (Tuesday’s) and updated 60-minute charts below.
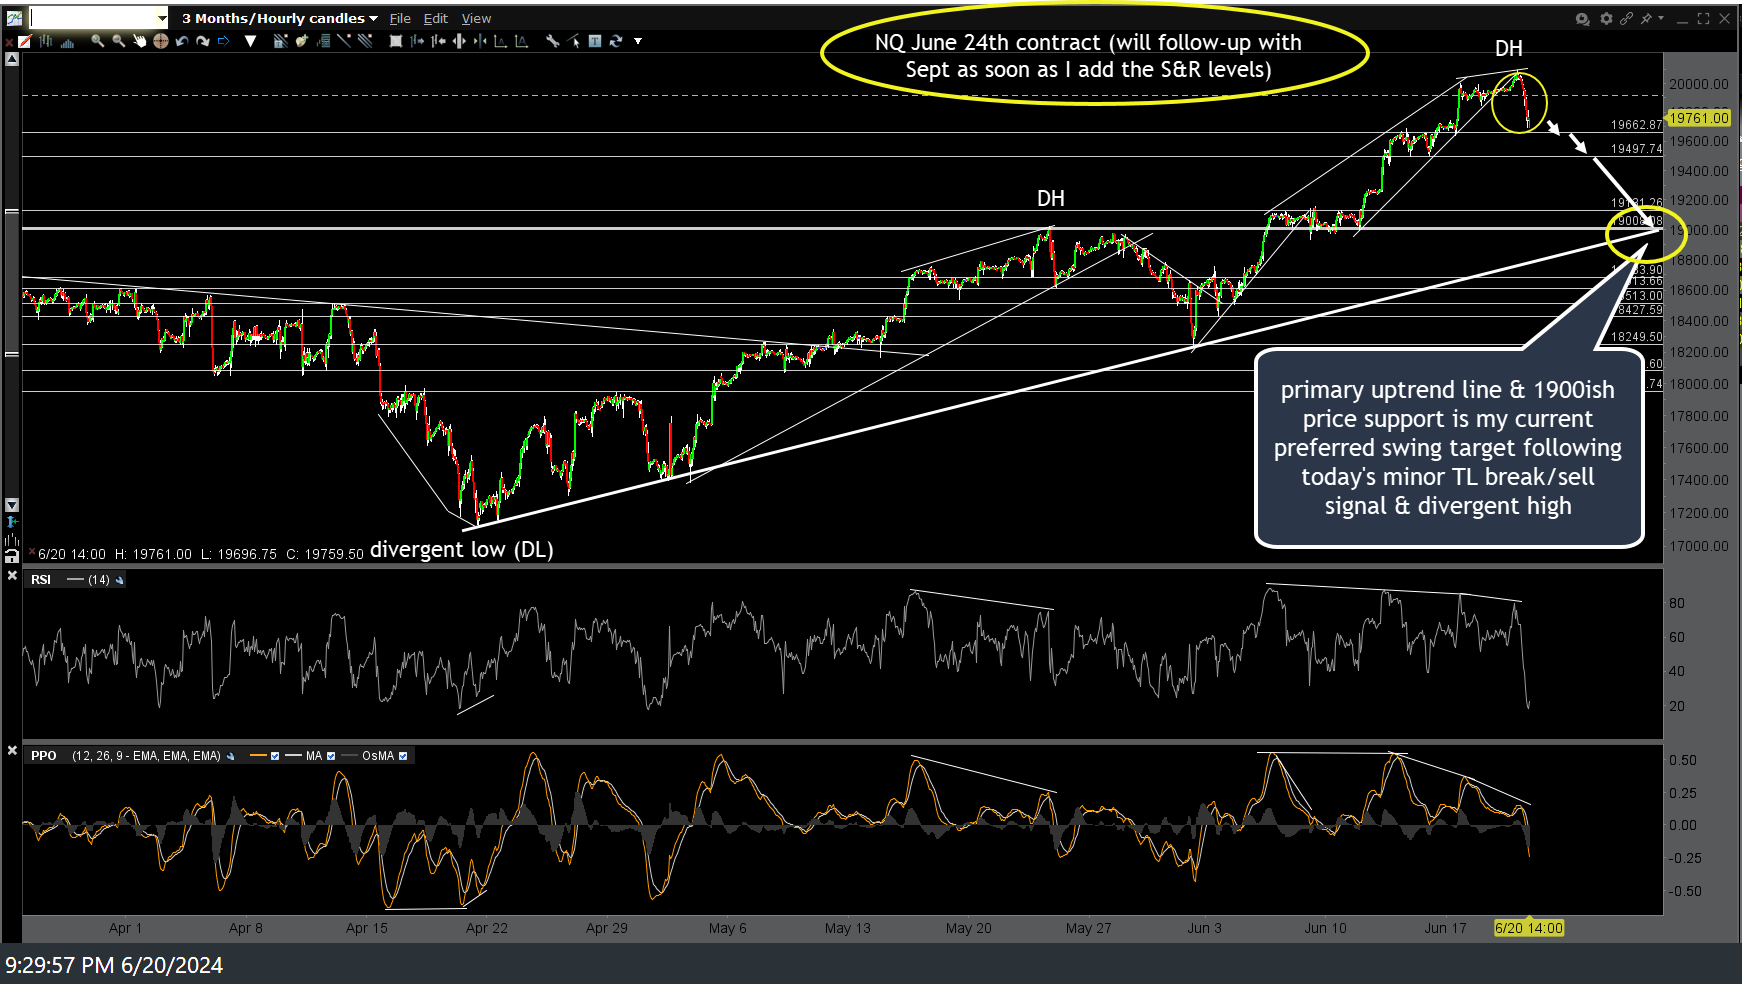
Here’s the /NQ (Nadsaq 100 futures) 60-minute chart (June contract) with the comparable swing target of the intersecting primary uptrend line + 19,000ish price support. I haven’t had a chance to mark up the new current September contract as working off the laptop when traveling is a bit more clunky & time-consuming but I will follow up with the annotated chart of the Sept contract asap although the levels are very similar.
A couple of things worth noting: NVDA is poised to print a bearish engulfing candlestick today and that Nasdaq variation of the Hindenberg Omen that I covered recently triggered all criteria again on Tuesday (markets were closed for Juneteenth yesterday). I believe that is the 3 firing of that signal within the past couple of months. I included a link to the Wikipedia description of the H.O. in that previous post with the screenshot of the H.O.


