
A basically perfect call on what I still believe is likely to be THE market top, not just a near-term top with /NQ (Nasdaq 100 futures) peaking at my “2100ish ideal market top” level posted back on July 10th (also aligning with my QQQ 511.74ish market top posted back in June). /NQ was good for tradable bounces (i.e.- covering the short & reversing to long, then back short again when my bounce targets were hit) so it is yet to been seen if we’ll get a tradable bounce off T3 which was hit yesterday, as highlighted in the last video. Previous (July 10th) & updated daily charts below.

NQ daily July 10th

NQ daily July 25th
While a little wiggle room regarding support levels needs to allowed when trading off the daily time frame, especially considering that the market moves a lot faster to the downside during corrections than when in an uptrend (hence, relatively brief momentum-fueled overshoots of support are fairly common), one can/should use the intraday charts for more precise entries & exits, such as this 15-minute chart below.
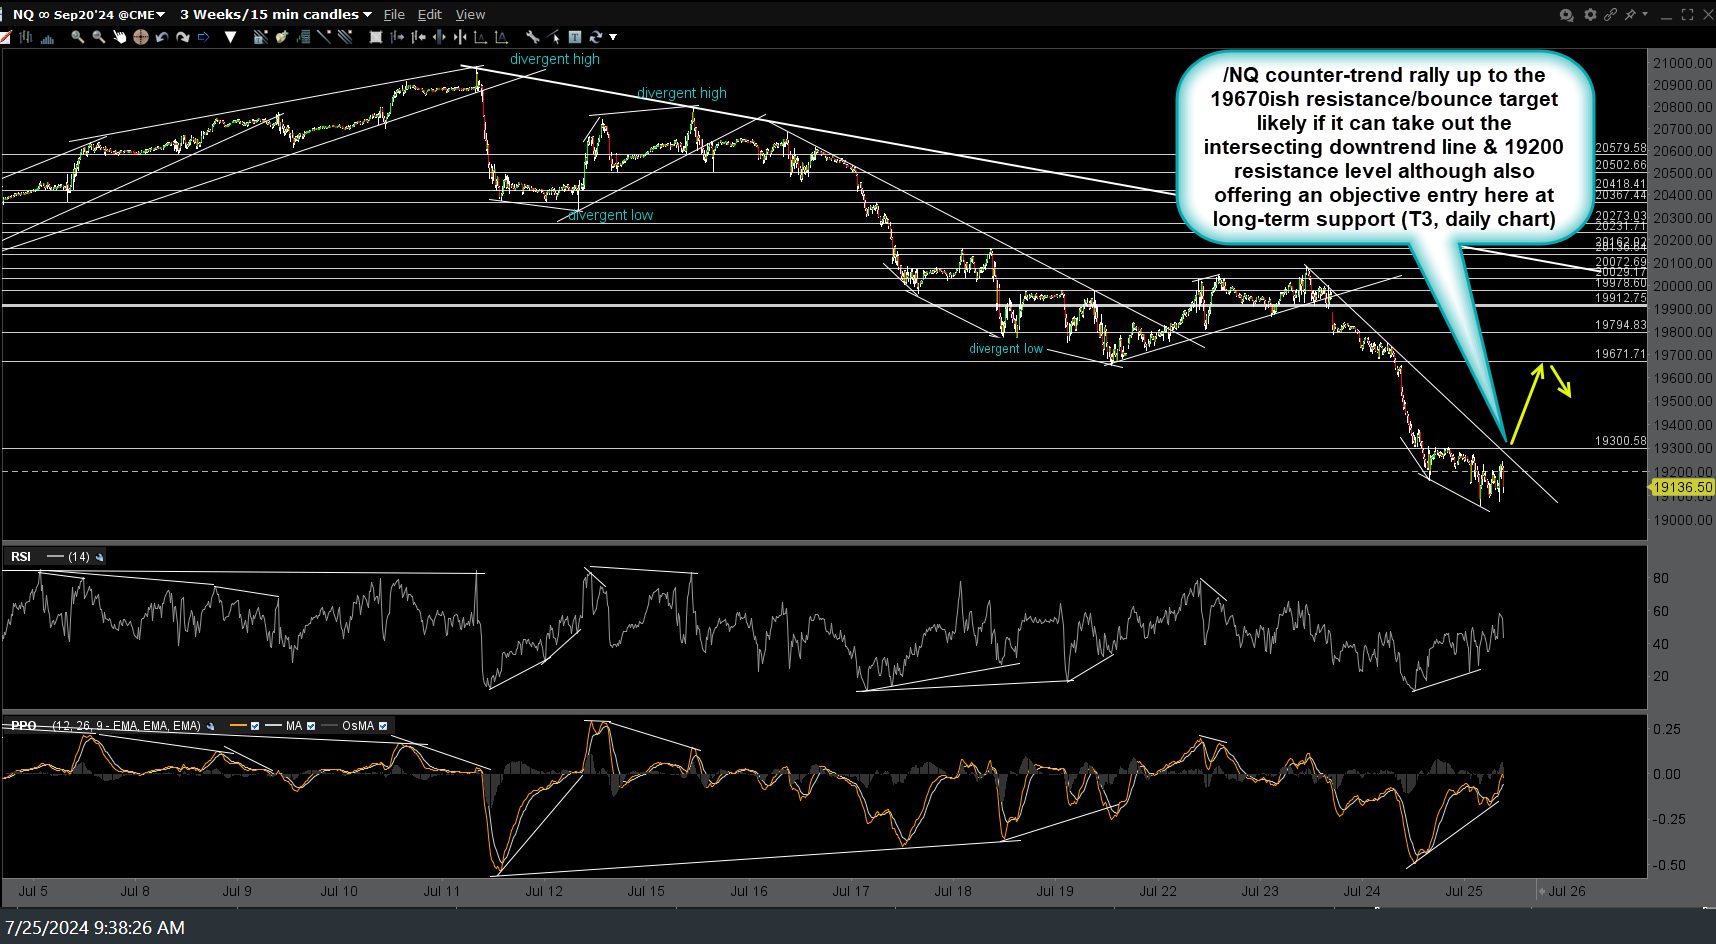
NQ 15m July 25th
/NQ counter-trend rally up to the 19670ish resistance/bounce target is likely if it can take out the intersecting downtrend line & 19200 resistance level although also offering an objective entry here at long-term support (T3, daily chart). Otherwise, if the buyers don’t step in here soon & the recent lows (i.e.- T3) is taken out with conviction, that would likely be the catalyst for a (rather swift) move down to T4, which is much better support with even better odds for a tradable bounce, if & when hit.