
I figured I’d pass along these two updates I made under the comment section below this morning’s post on /NQ & QQQ for those interested (cut & pasted):
/NQ rejected off the 2nd run at the 11175ish resistance after the opening bell, no sell signal yet although a pullback to this 11044 & minor TL support as well as a deeper pullback to the primary uptrend line off the lows would also offer an objective long entry with stops below the recent lows. https://rightsideofthechart.com/nq-qqq-60-minute-charts-1-3-23/#comment-25784
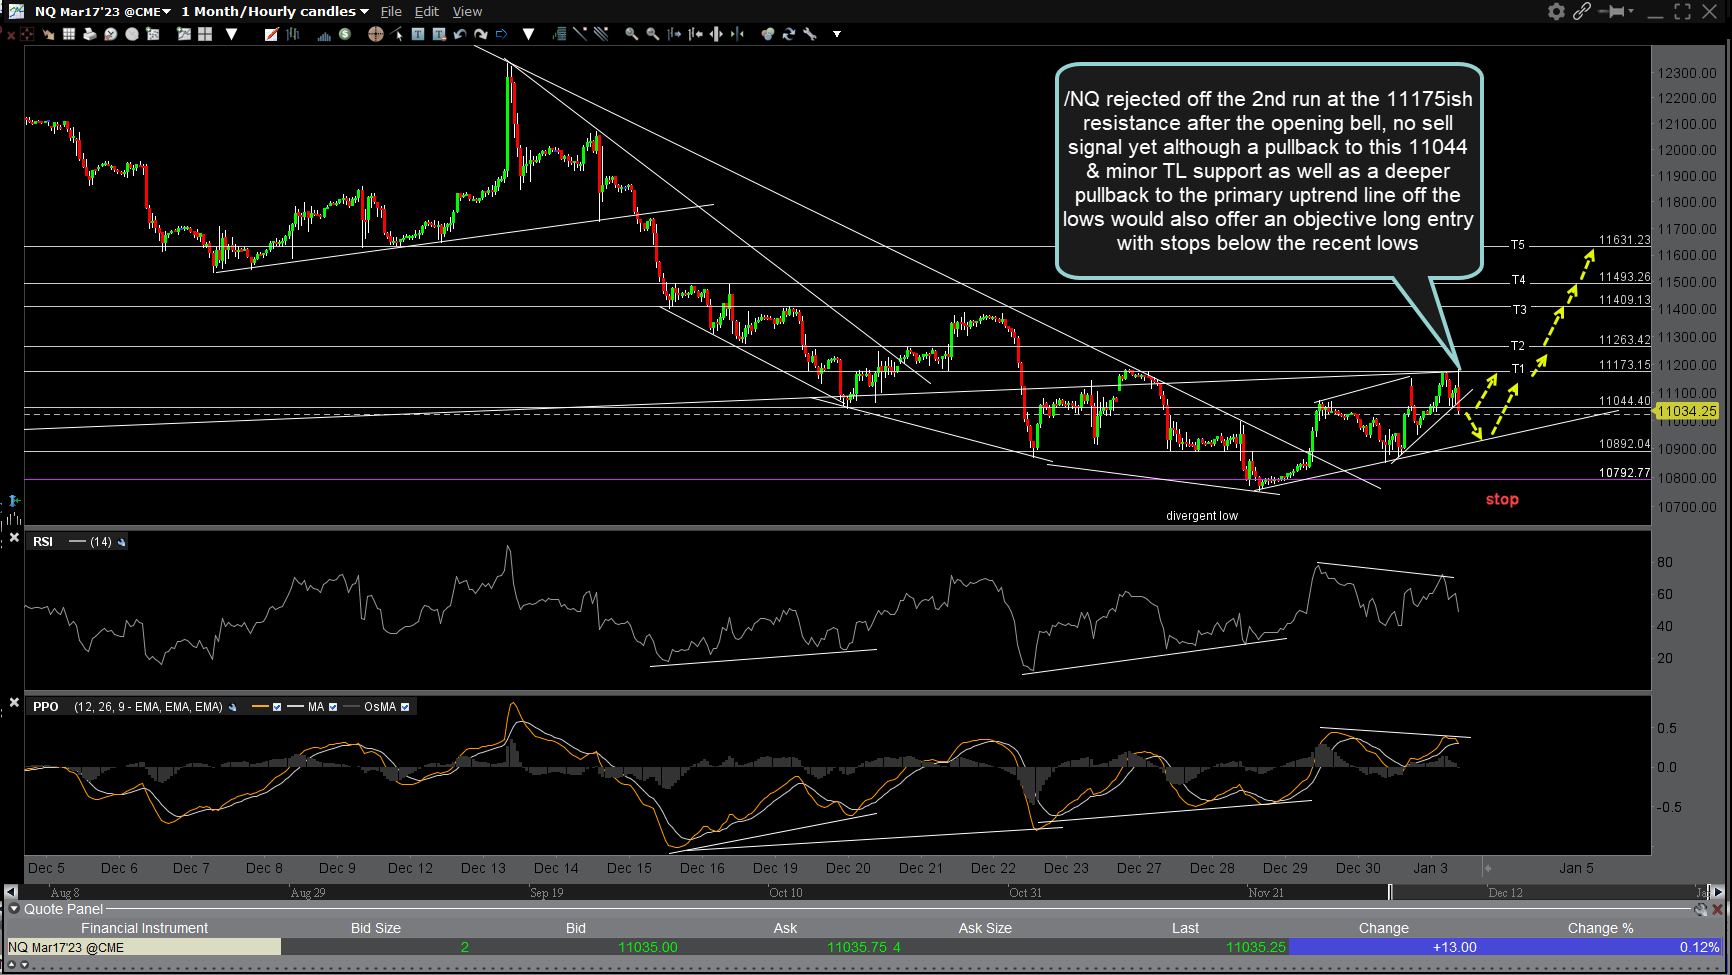
NQ 60m 2 Jan 3rd
/NQ objective long entry here at the intersecting uptrend & downtrend lines (triangle apex), zoomed down to a 10-min time frame below. One could use a tight stop somewhat below current levels or a slightly wider stop below the recent lows. https://rightsideofthechart.com/nq-qqq-60-minute-charts-1-3-23/#comment-25788
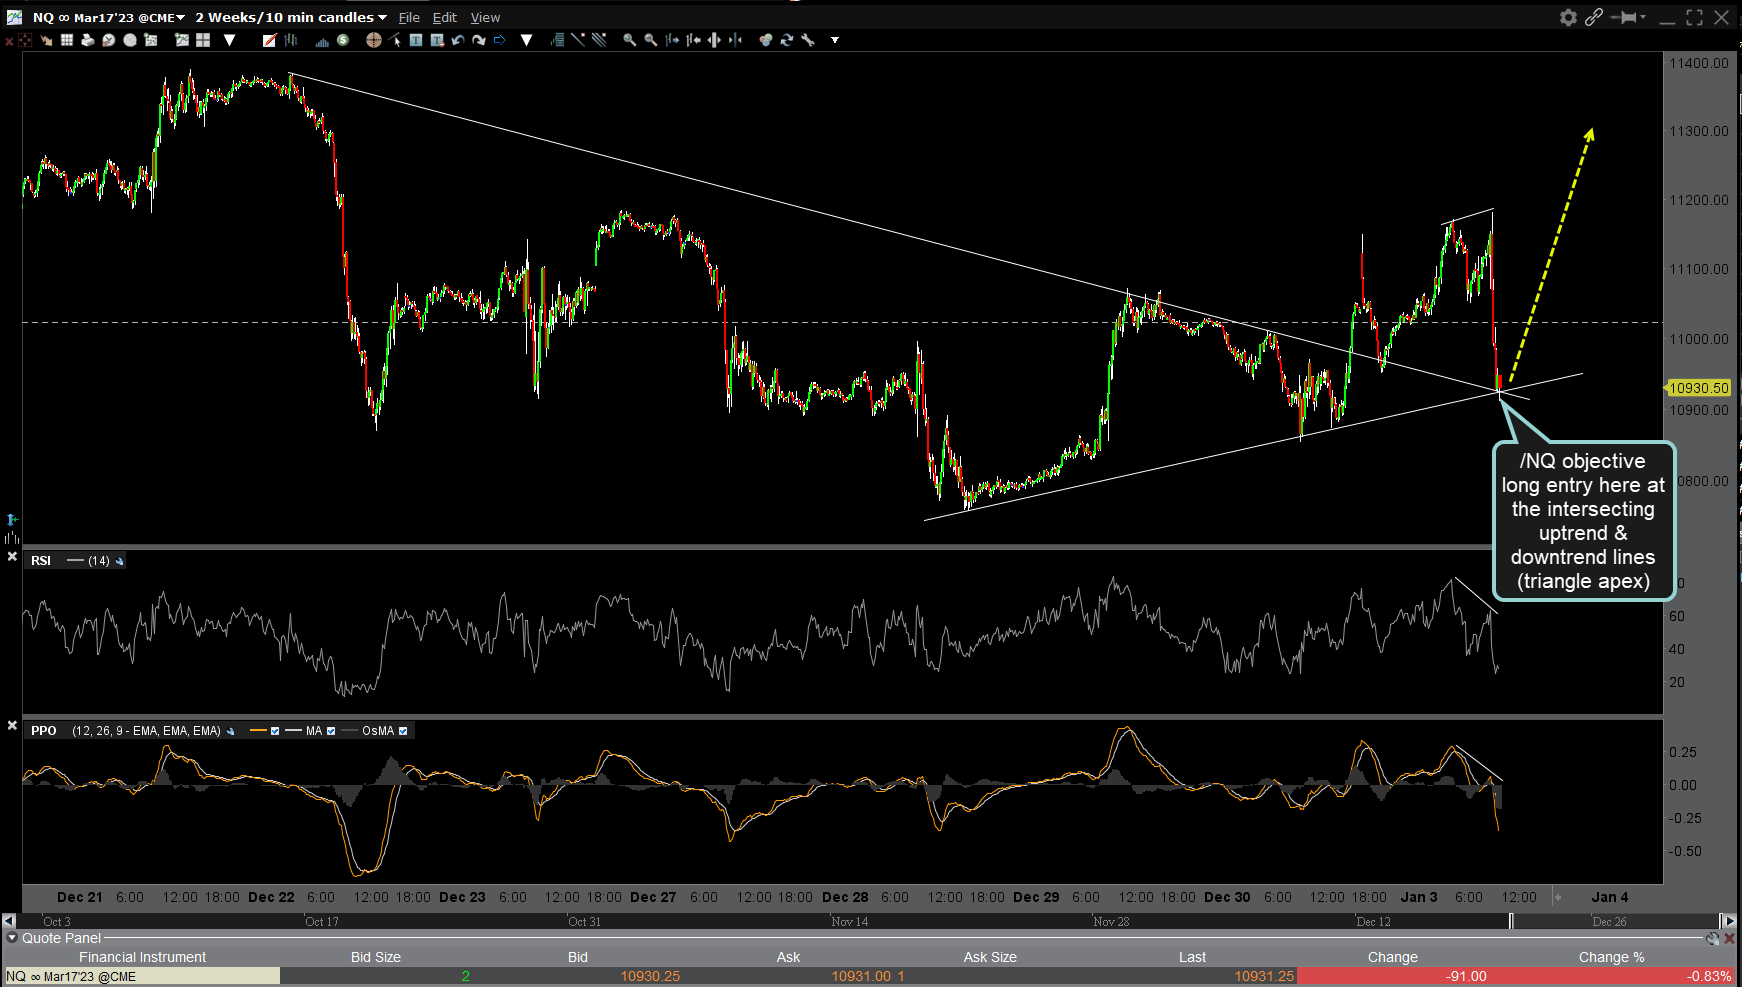
NQ 10m Jan 3rd
I also made the following reply to a comment by a member regarding AAPL and that market-leader is currently backtesting the 60m wedge from above:
AAPL 130.50 aligns with the 11175ish resistance on /NQ, both of which need to be taken out to kick-start a rally. Although AAPL failed on the 130.50ish breakout right out of the gate so far, it is still above the 60-minute bullish falling wedge pattern that it broke out above last week. (updated 60-minute chart below) https://rightsideofthechart.com/nq-qqq-60-minute-charts-1-3-23/#comment-25786
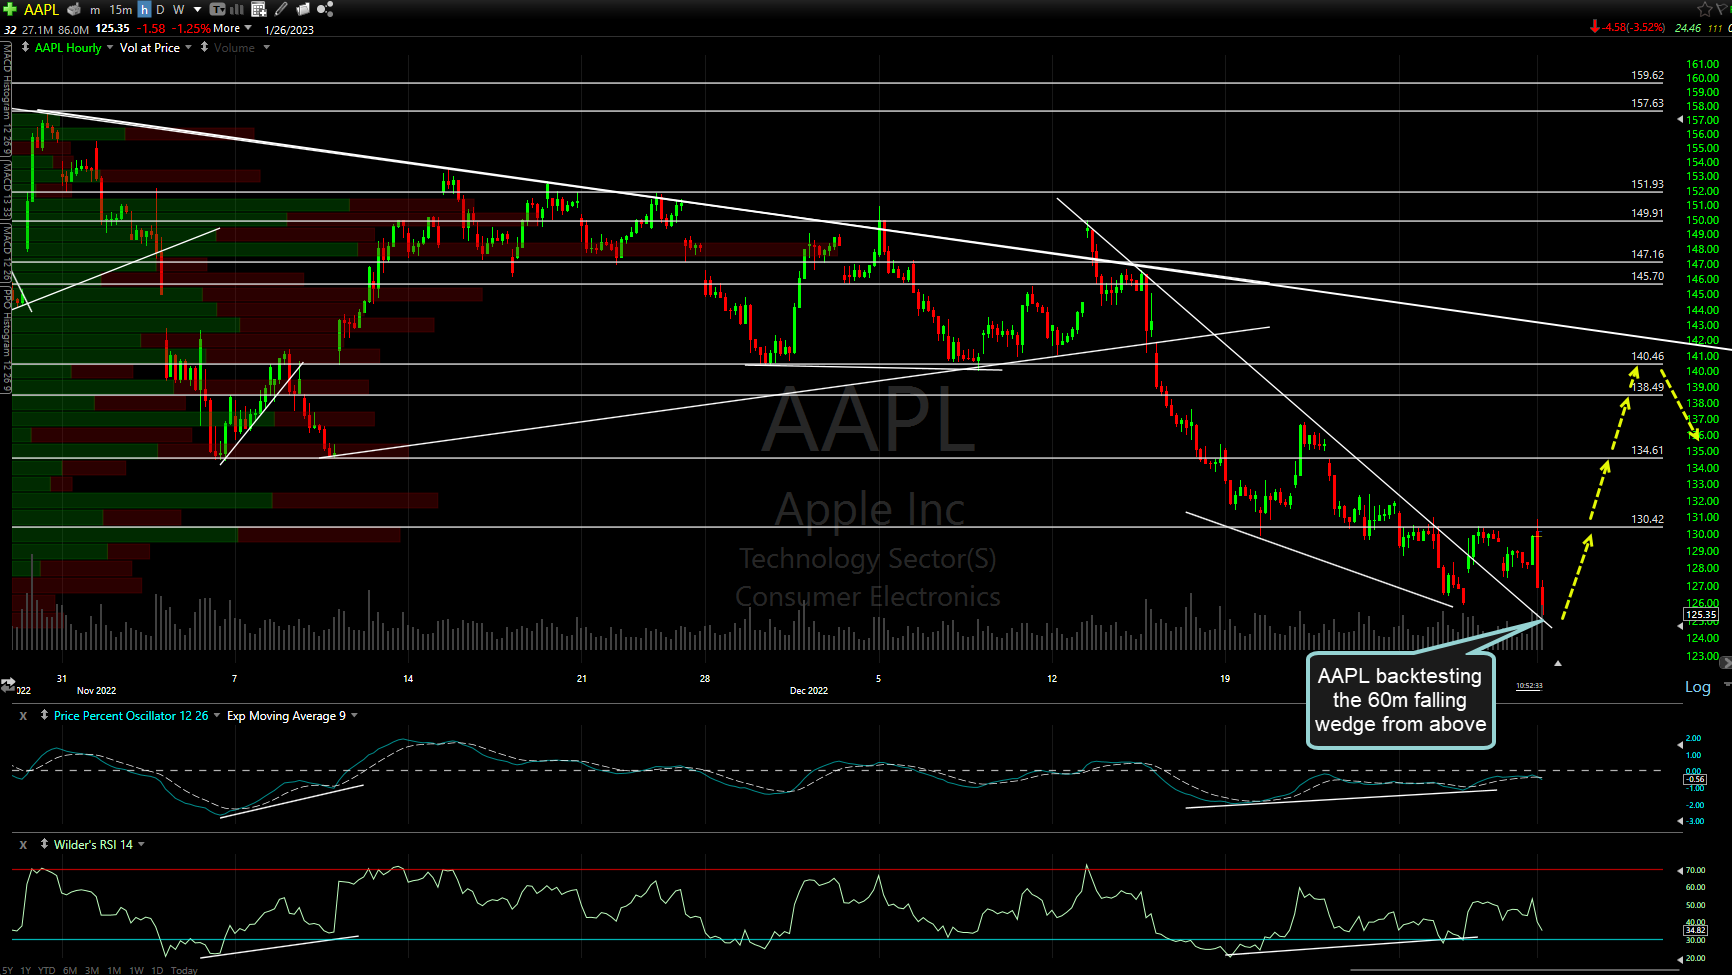
AAPL 60m 2 Jan 3rd