
Following the brief dip below & subsequent recovery back above the key 6947ish support level, which put the previously discussed bear trap scenario in play, /NQ hit the first price target (T1) yesterday after the close of the regular trading session for the 2nd time since adding it was first added as a bounce target before the market opened on Wednesday. Both the downtrend line & the 7557ish resistance level were hit at the same time as dual, intersecting resistance levels followed by yet another pullback & successful test of the 6947ish key support level.
-
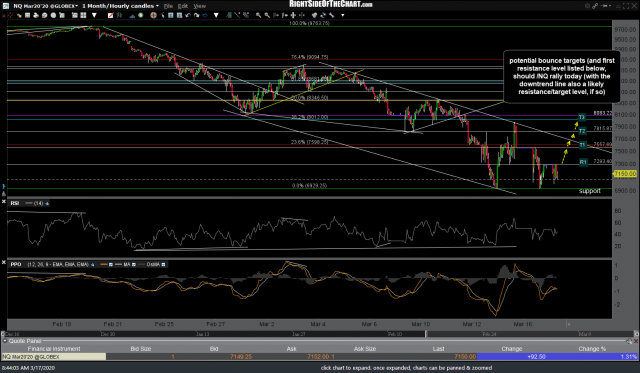
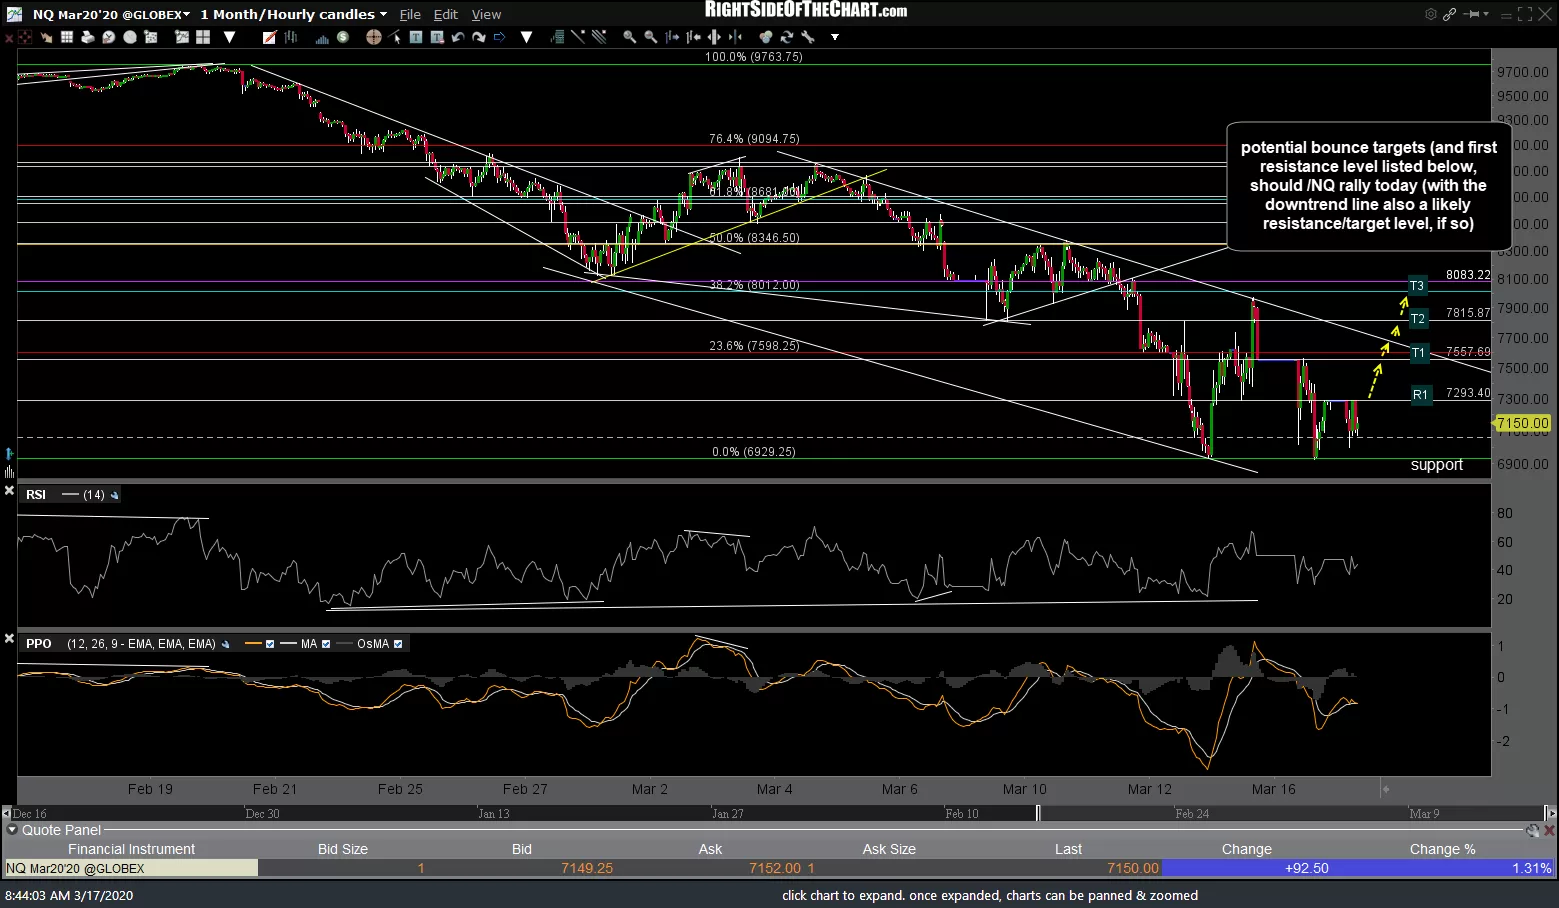
- NQ 60m March 17th
-
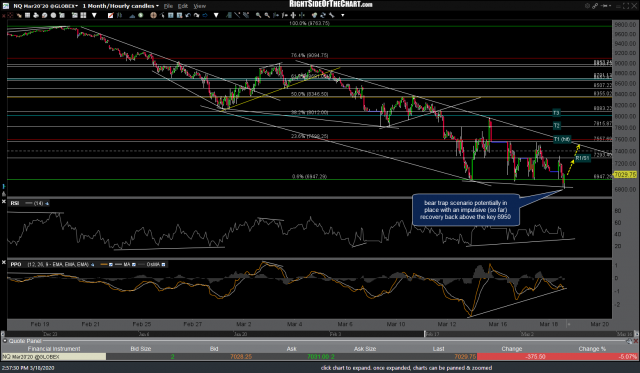
- NQ 60m 3 March 18th

-

- NQ 60m March 19th
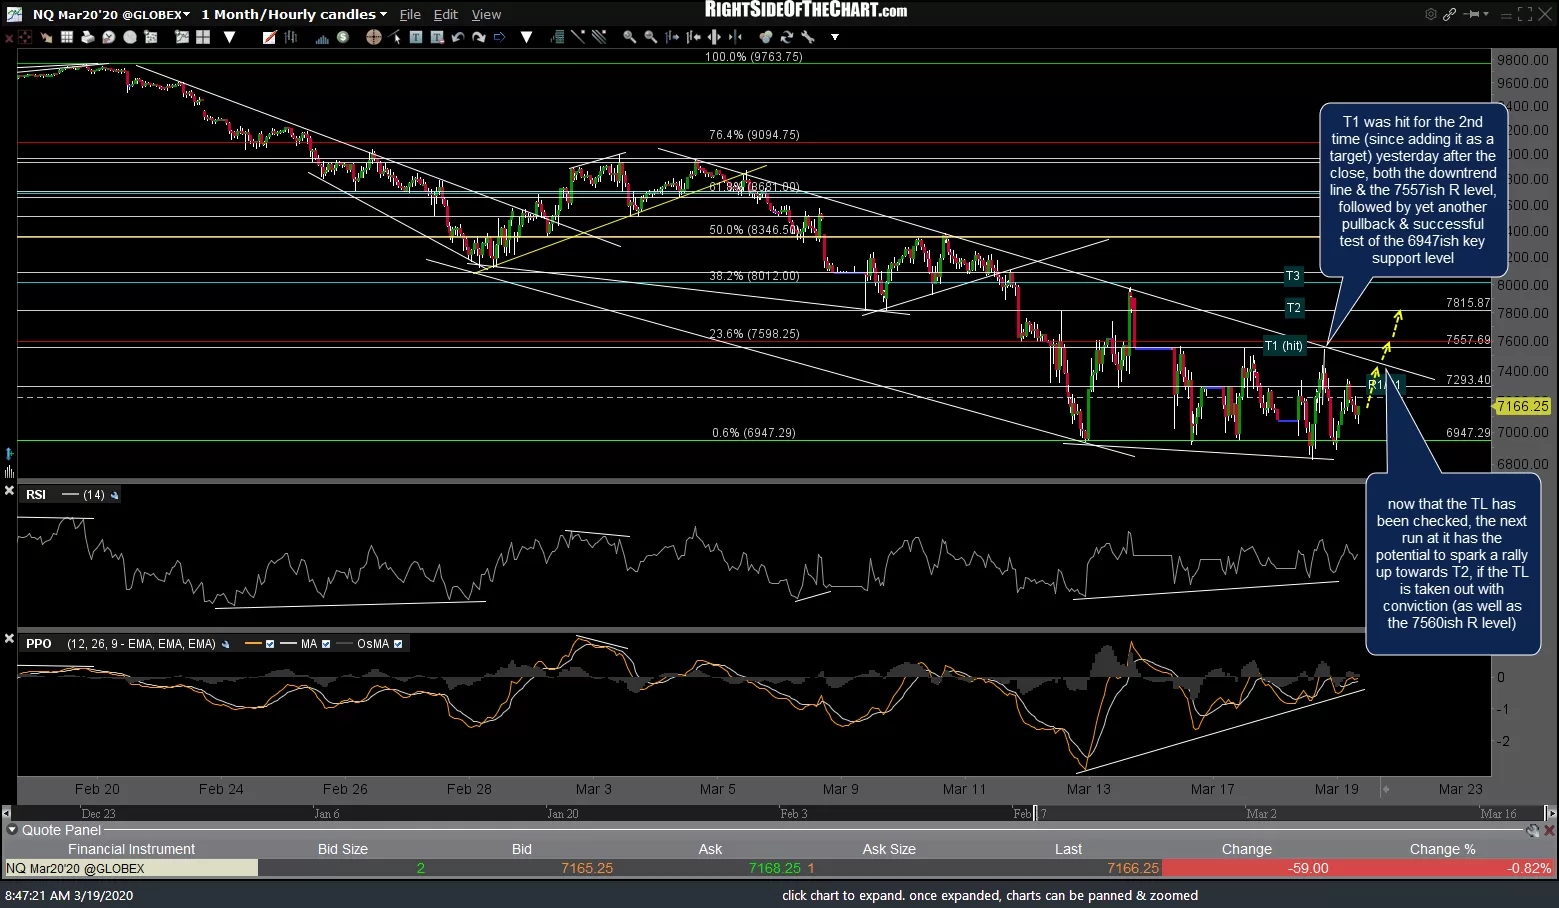
The first chart above below is the 60-minute chart of /NQ that was posted about an hour before the market opened on Wednesday, first highlighting the bounce targets & key support level that has continued to contain the recent plunge in the stock market so far, followed by yesterday’s chart highlighting the bear trap scenario in play along with today’s updated chart which shows that 2nd rally up to T1 & the downtrend line followed by yet another successful test (so far) of the key support level & yet another objective long entry for active traders attempting to profit from this recent game of ping pong between the 6950ish support & the 7557ish resistance/target.
Now that the trendline has been checked for the first time since last Friday, as I had been leaning towards over the past couple of trading sessions, the next run at it has the potential to spark a rally up towards T2 if the trendline is taken out with conviction (as well as the 7560ish R level). I am leaning towards that scenario happening today although keep in mind that today is what is referred to as quadruple witching, meaning that we have stock index futures, stock index options, stock options, and single stock futures all expiring simultaneously today. Quadruple witching typically results in increased volatility so get ready to strap in & hold on if you plan to trade today.
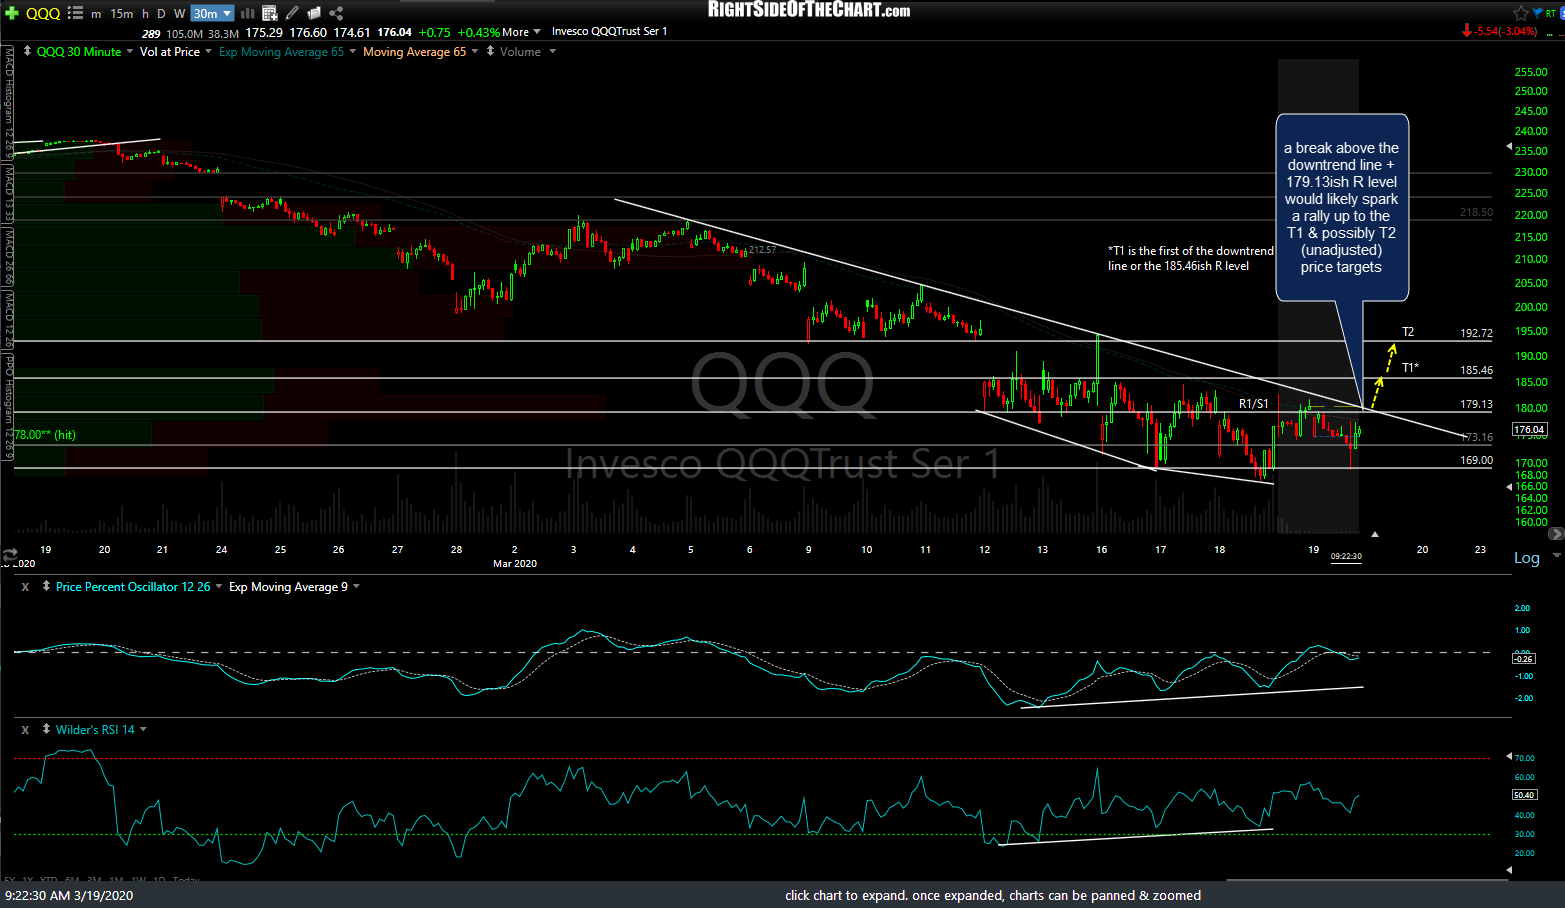
QQQ 30m March 19th
Should the volatility go the way that I think it will (mostly up), then QQQ has a decent shot of hitting the first & possibly second targets that were shared recently on the 30-minute time (above) with a break above the intersecting downtrend line + 179.13ish resistance level to provide the next buy signal. Needless to say, a solid break below yesterday’s lows would be bearish with the potential to spark another impulsive wave of selling. Best of luck today & as always: When in doubt, stay out (of the market).