
As of now, I’m favoring a relatively small near-term oversold bounce here, followed by another leg down & then a reversal off or around the top of the 2946-2939 support zone on /ES +/-, depending on where /NQ is & how the charts look at the time. /ES (S&P 500 futures) 60-minute chart below.
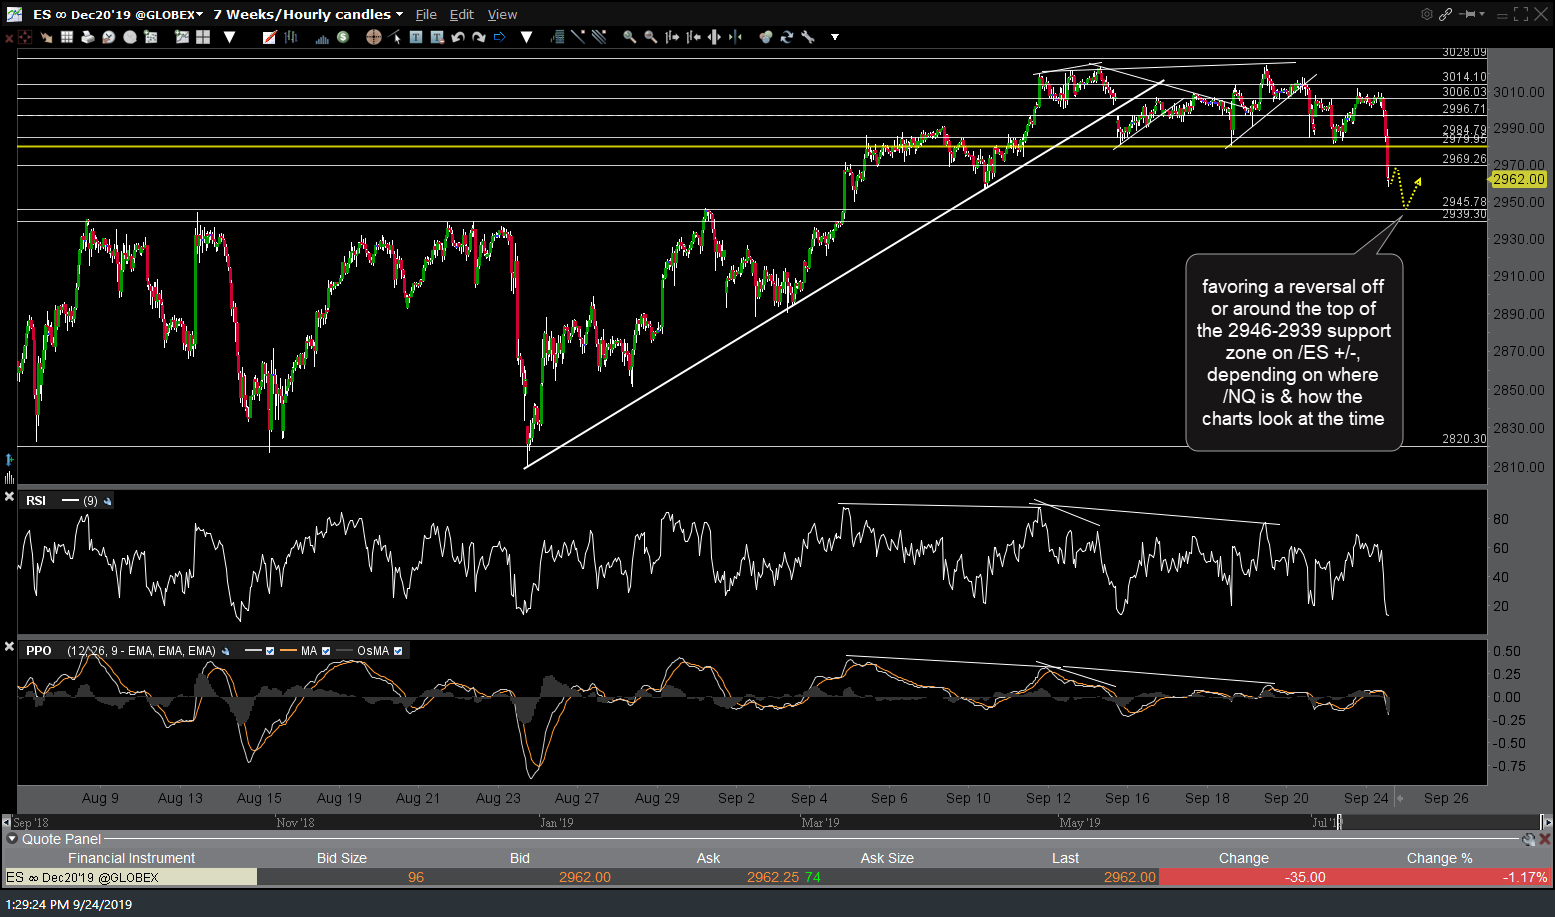
ES 60m 2 Sept 24th
I’m targeting the 7670.50ish support for a reversal in /NQ (tradeable bounce, reversing slightly above that support level +/- depending on where /ES is at the time). Nasdaq 100 futures 60-minute chart below.
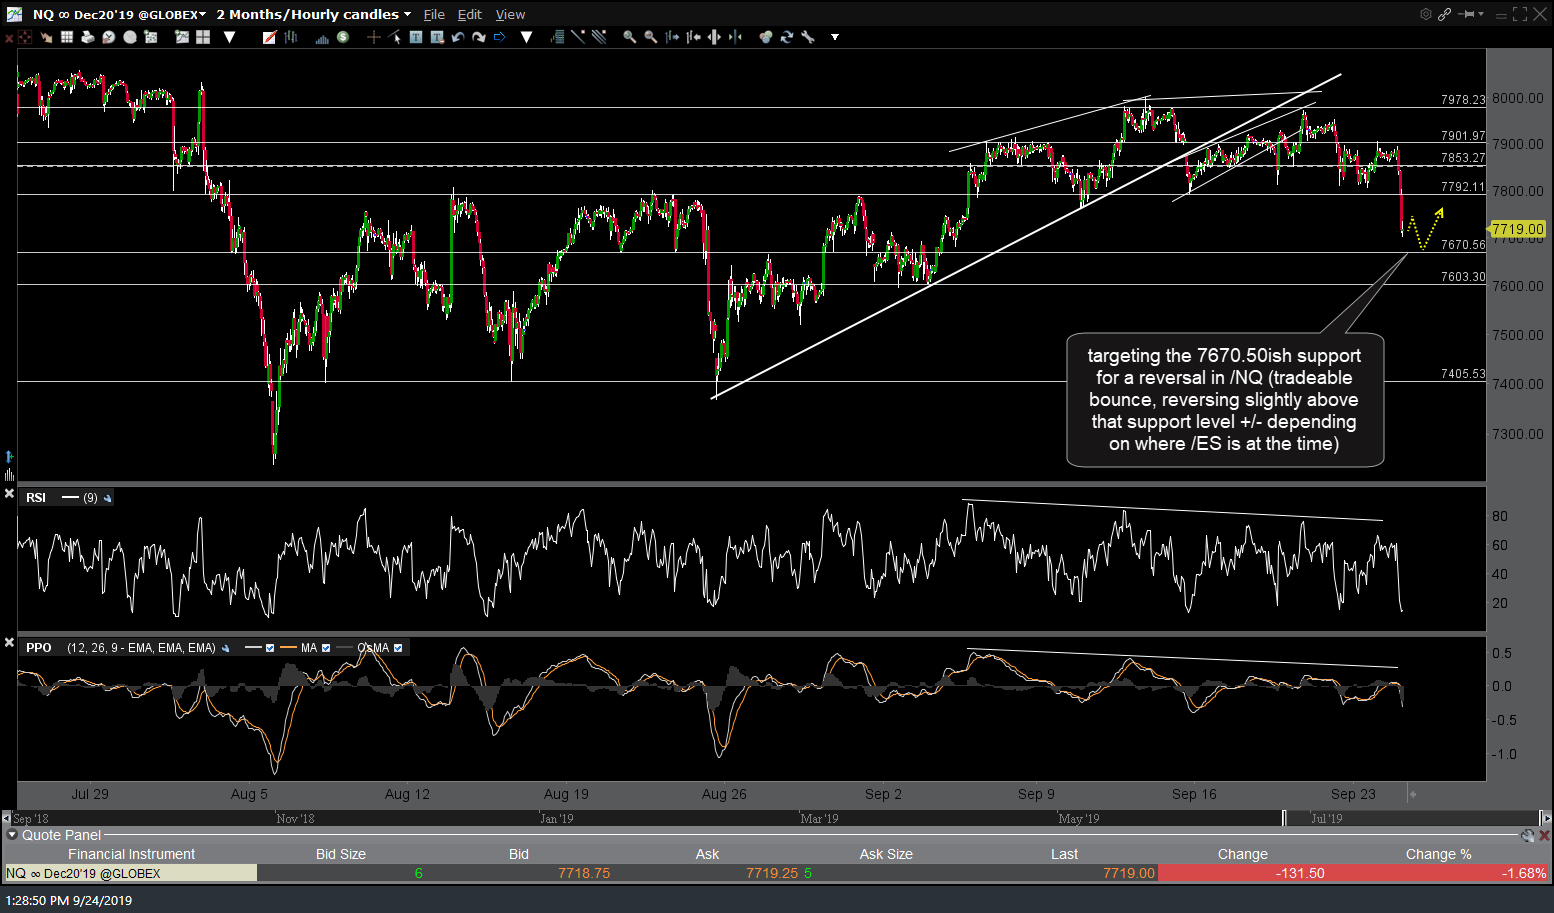
NQ 60m 2 Sept 24th
Depending on how /ES & /NQ look at the time, I will likely be reversing /RTY (Russell 2000 futures) from short to long around the 1528.50 support level and I will do my best to follow up with some charts of SPY, QQQ & IWM with comparable price targets asap.
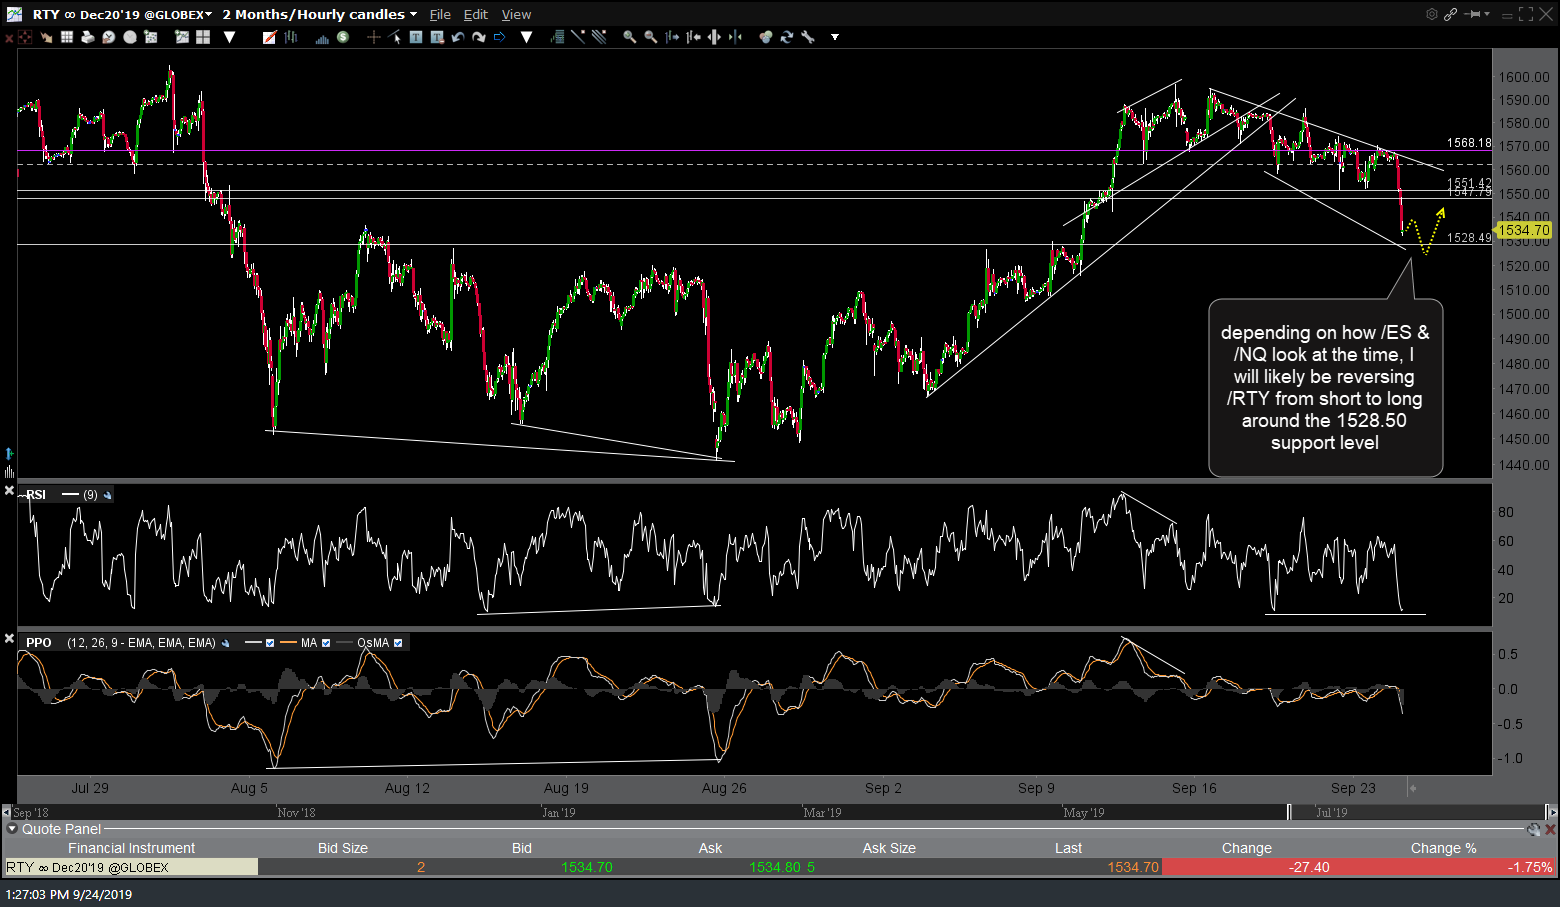
RTY 60m Sept 24th
On a final note, although I think the odds for a tradable bounce (i.e.- cover index shorts & reverse to longs for a bounce trade) are good if & when these targets are hit soon, as I discussed towards the end of today’s mid-session update video, we could get some more powerful sell signals on the more significant daily & weekly time frames between now & then & if so, that could usher in a more powerful wave of selling that takes the S&P 500 well within & possibly below the August trading range.
I will do my best to post any significant developments or changes to my near-term outlook but just wanted to remind all that anything can happen in the market so be flexible, make sure to use stops and keep your position size light (or stay out of the market) if you are unsure what to do. G-luck on your trades.