
Following the buy signal on the impulsive breakout of the 60-minute bullish falling wedge pattern earlier today, /NQ (Nasdaq 100 futures) has just hit & slightly taken out the 12223.50ish target on what is likely a momo-fueled overshoot, with a minor pullback likely before the next leg up.
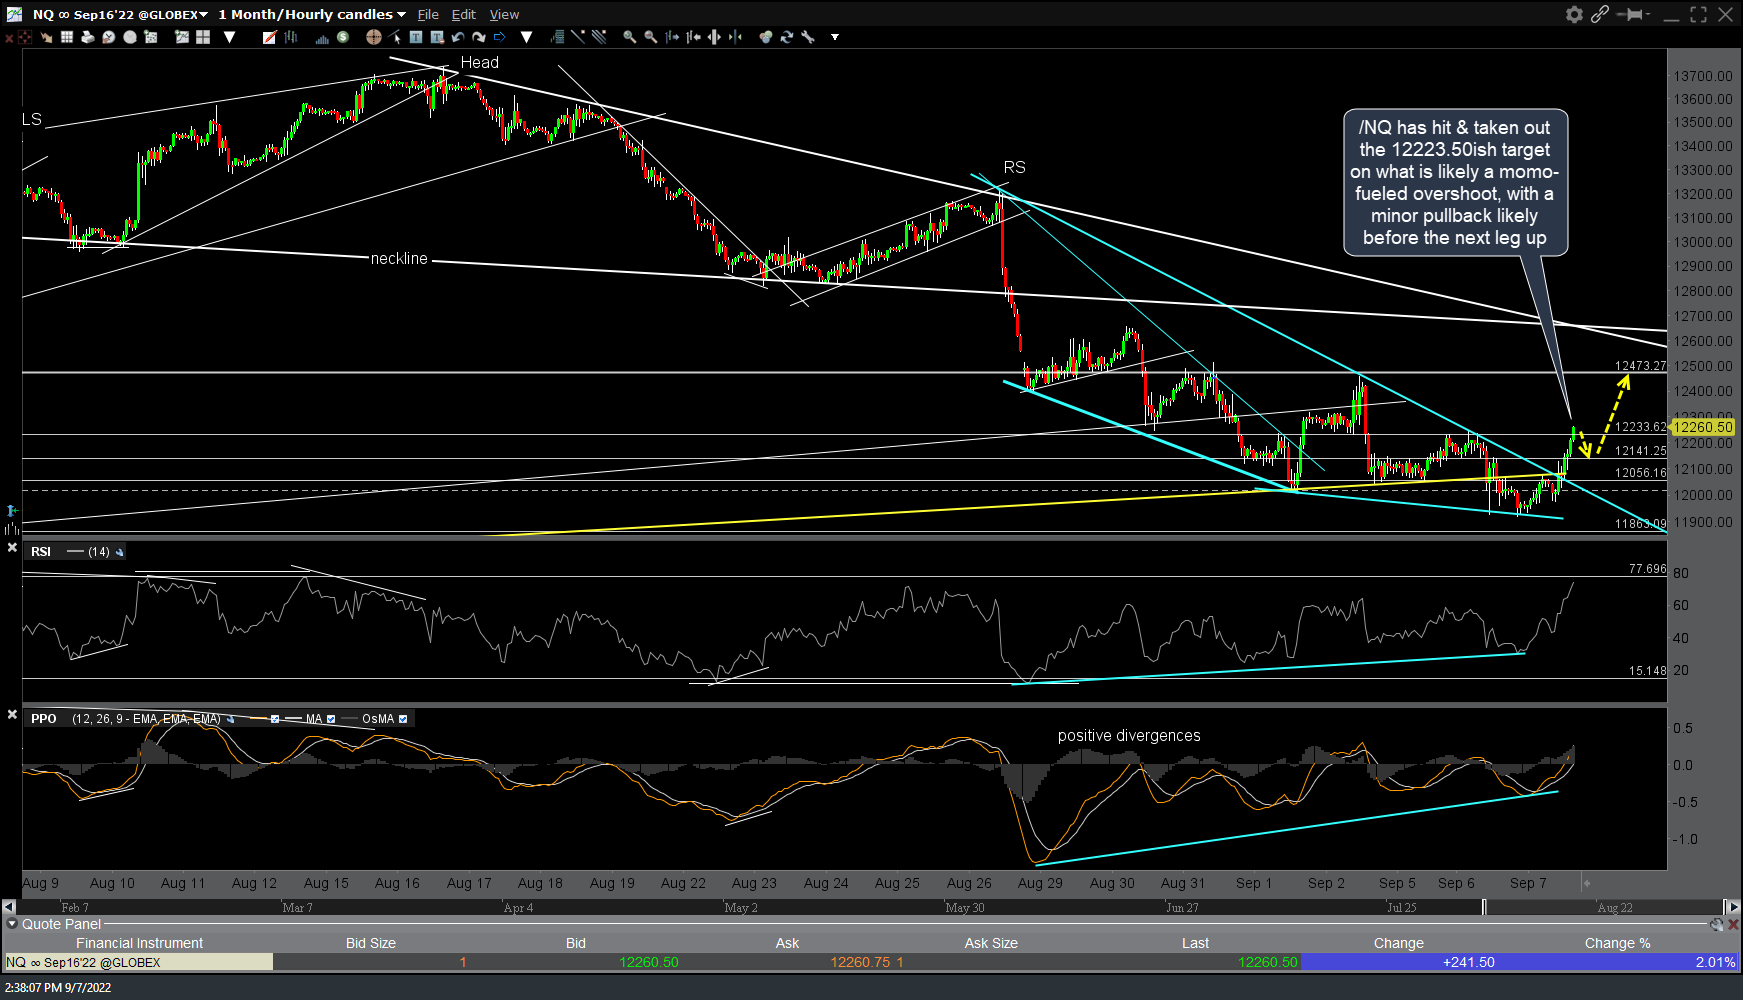
NQ 60m 2 Sept 7th
Zooming down to the 5-minute time frame, QQQ is coming up on the 299ish resistance where a day-tradable pullback off the initial tag (just below) is likely before the next leg up. Arrow breaks denote the levels likely to contain any pullback while any pullback to just above that 12141.25 initial target (former resistance, now support) on the 60-minute chart of /NQ above would also be an objective level for active traders to cover any pullback short trades & reverse back into a long position.
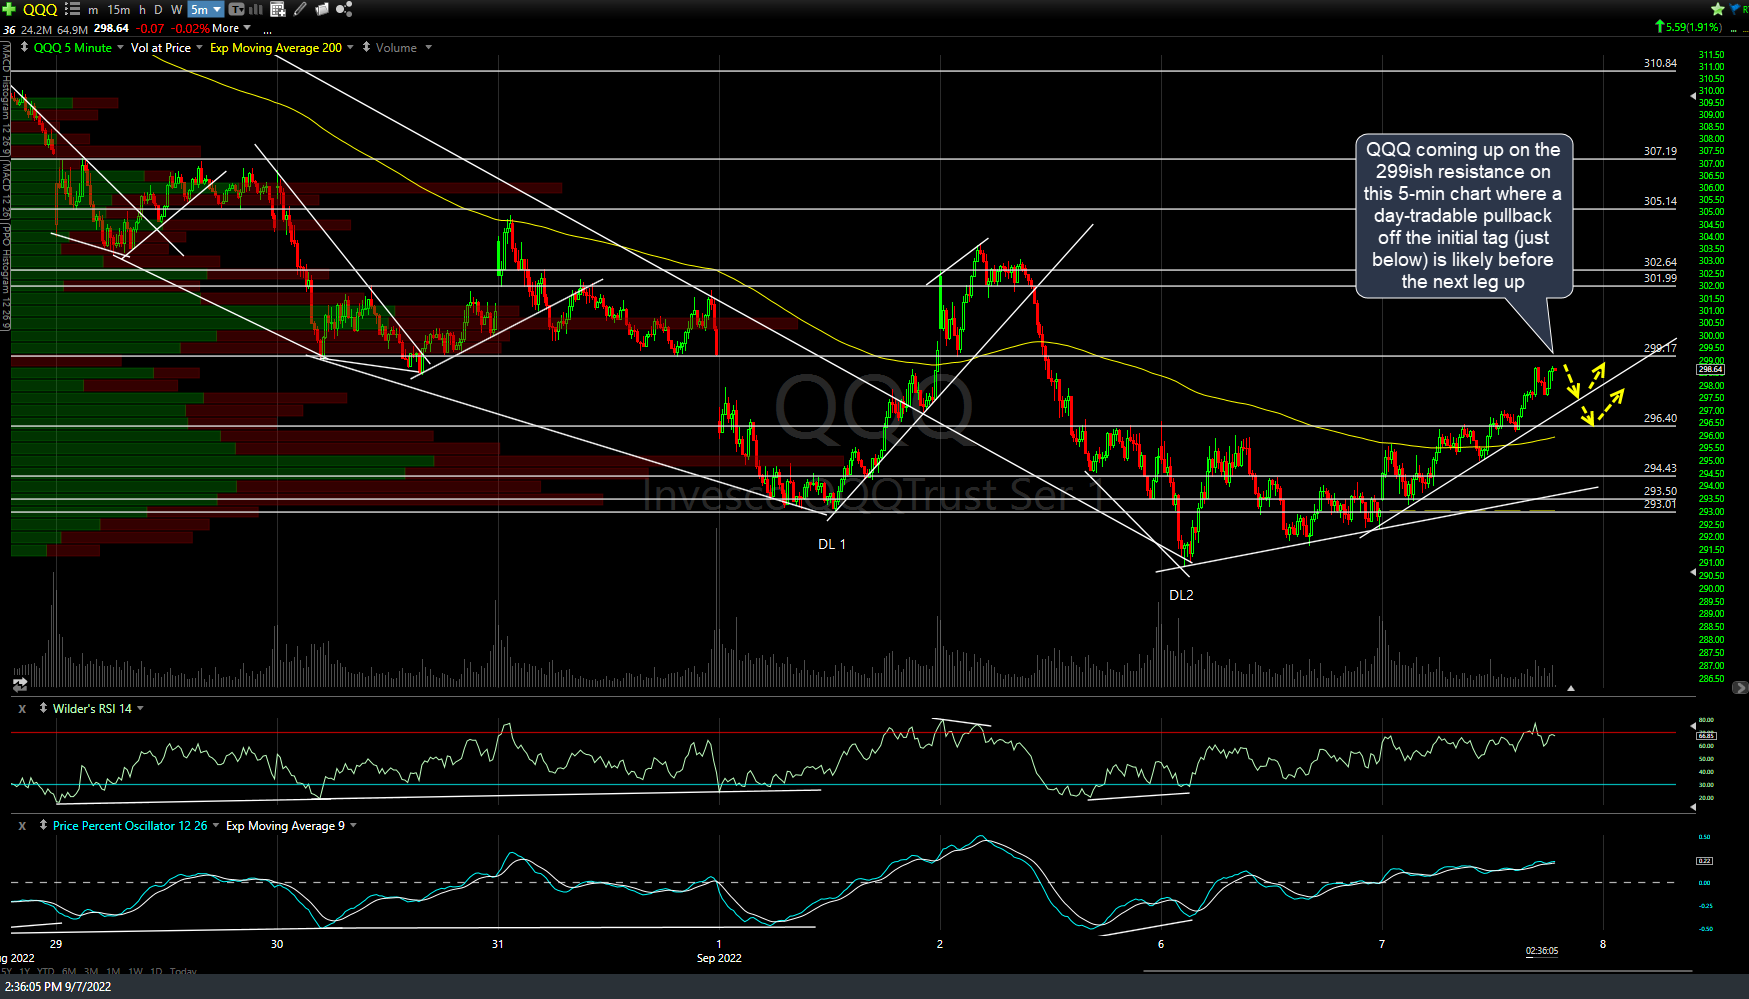
QQQ 5m Sept 7th
Of course, today’s breakouts are about as good as they come: Impulsive breakouts of the bullish falling wedges on /NQ & /ES followed by solid 60-minute candlestick closes above on both. As such, that, coupled with the recent extreme oversold readings & surge in bearish sentiment indicates that there is considerable more upside to come, whether we pull back here or not. As such, typical (less active) swing traders shouldn’t be concerned with trying to game any minor pullbacks.