
The entry/buy trigger for the recently posted UNG (or /NG) trade setup is being revised from a breakout above the 60-minute bullish falling wedge/downtrend line to current levels, which is long-term support, with a break above the wedge still to provide an objective entry or add-on. 60-minute chart below.

UNG 60m Jan 5th
The daily chart of UNG below shows the 11.80 long-term support with multiple reactions from above in below in recent years… a likely end-point for the current correction.
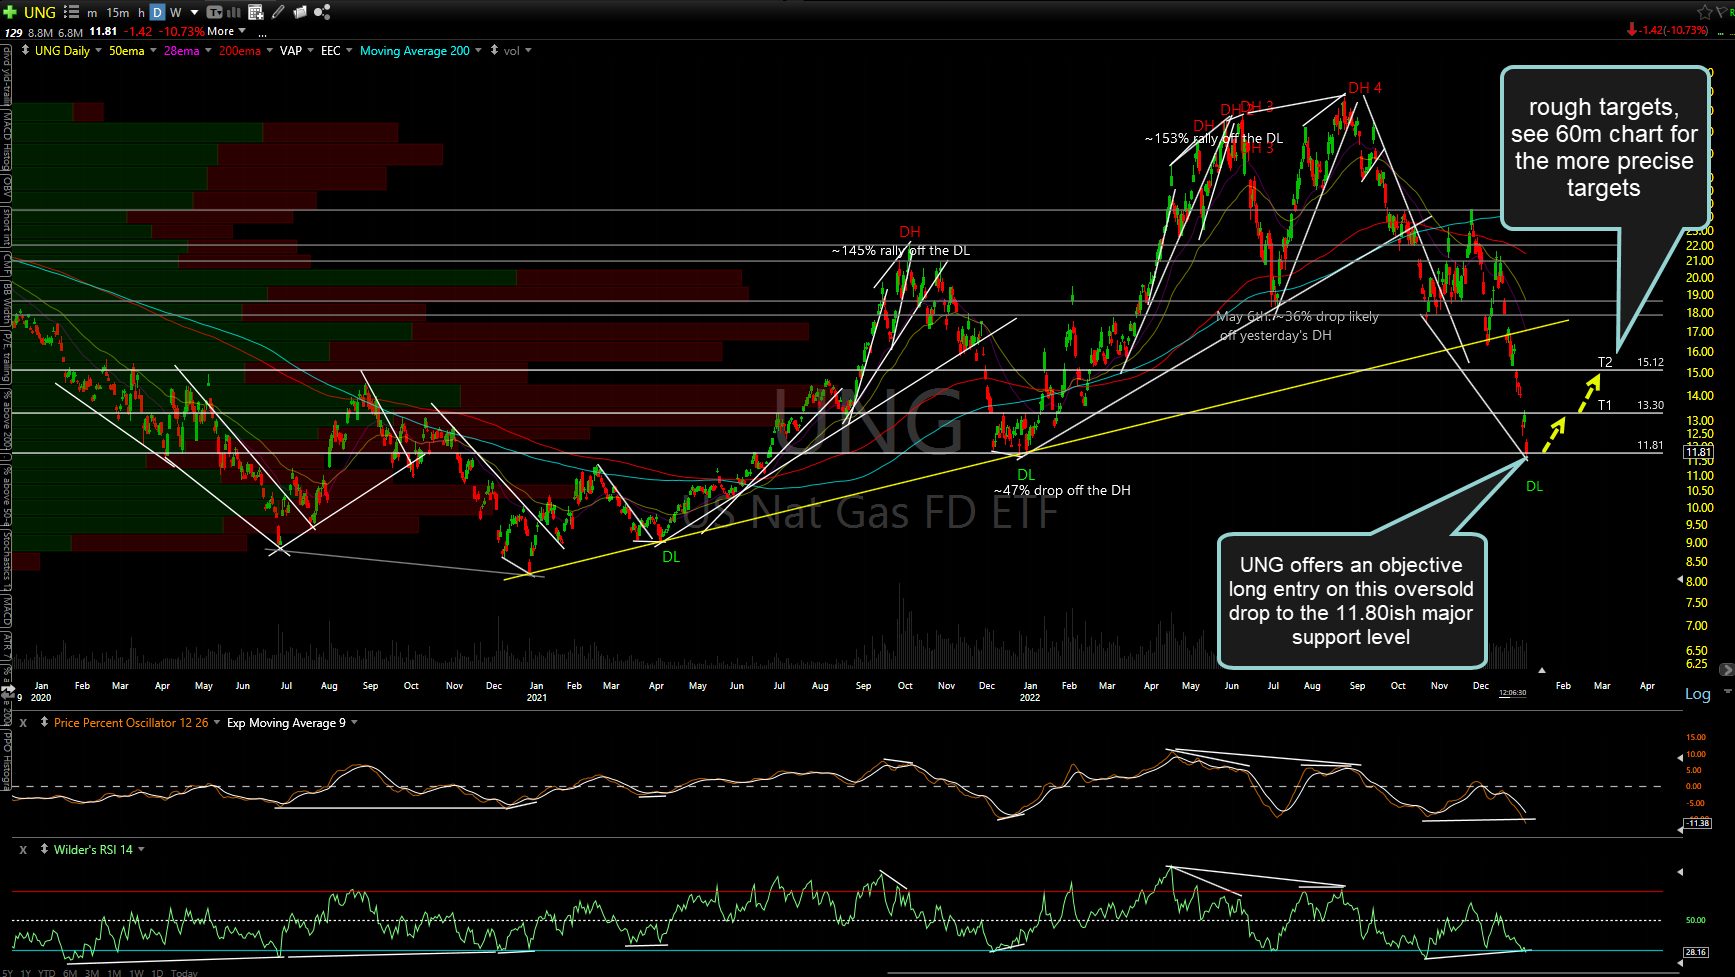
UNG daily Jan 5th
The chart below is the weekly chart of $NATGAS (natural gas futures, continuous contract). As this is an EOD (end-of-day) chart, it is only updated through yesterday’s close although nat gas futures are trading down about 12% right now to 3.682 as I type. That puts it right on the upper support level of this long-term support zone. Remember, there are two objective entry points for a long position: 1) On a breakout above resistance, including a bullish chart pattern and 2) On a drop to a support level which is likely to cause a reversal.
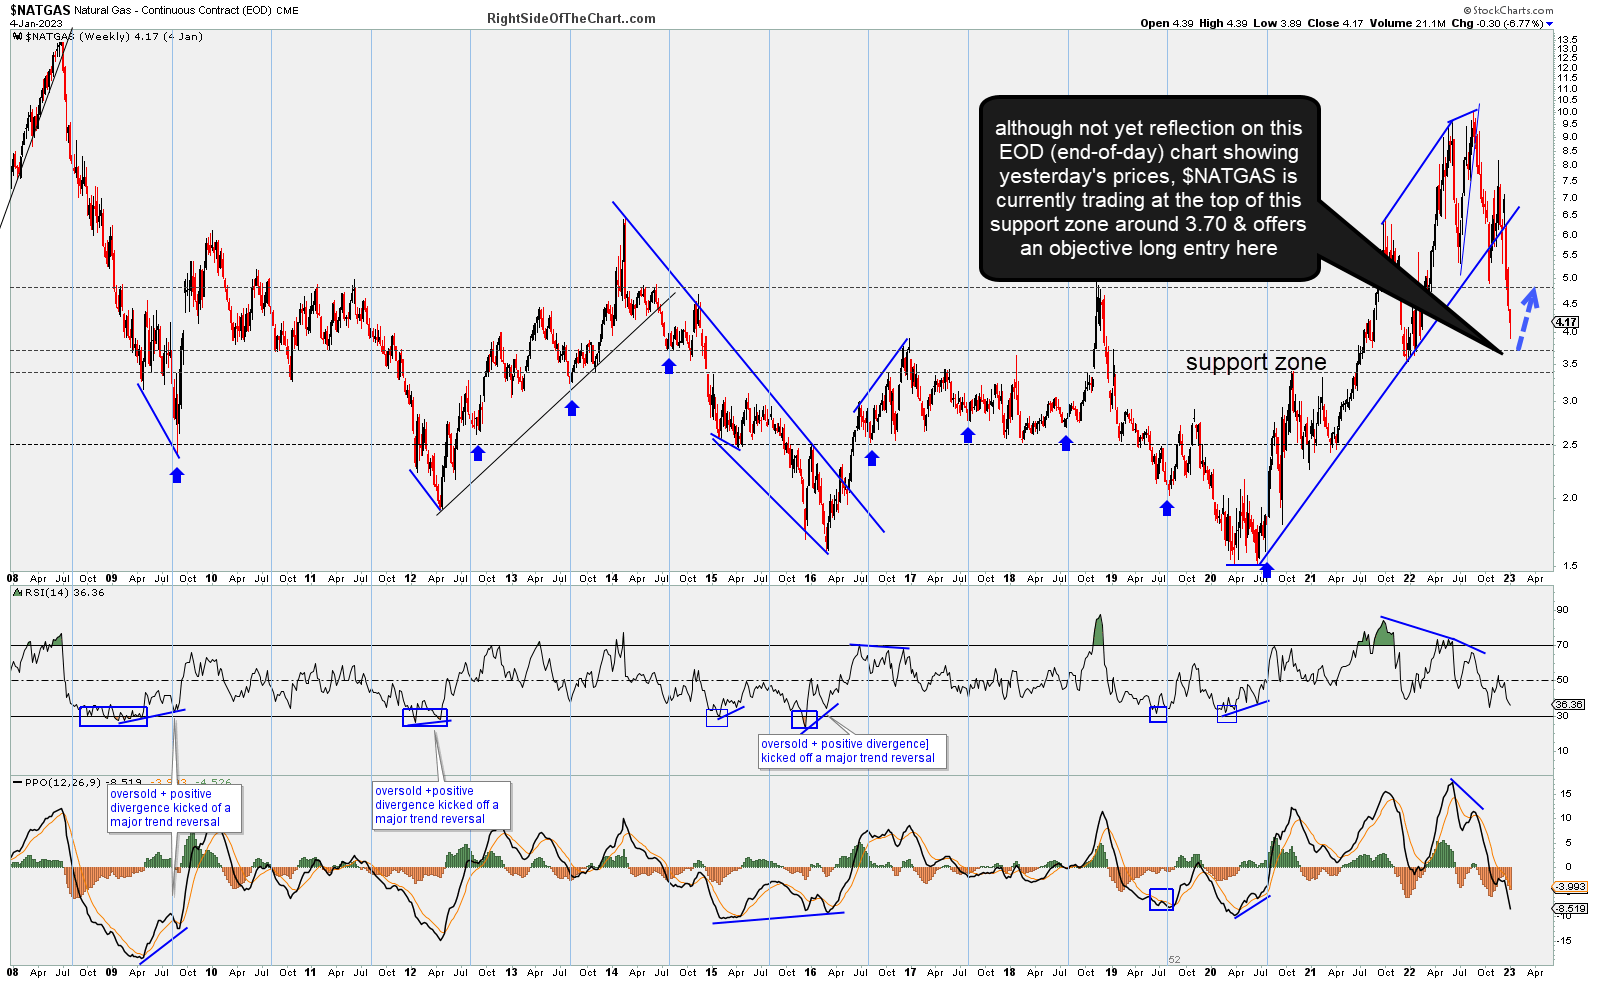
$NATGAS weekly Jan 5th
Although /NG (natural gas futures) remains within the descending price channel on this 60m chart, it offers an objective long entry here at long-term support with an objective add-on or new entry on a solid break above the downtrend line (the previous entry criterion). As with UNG, my price targets remain the same as posted on the previous setup. Stops should be commensurate with one’s preferred price target(s), ideally using a 2:1 or better R/R.

NG 60m Jan 5th