
/NG (natural gas futures) has just hit & taken out the 8.460 price target/support level but only on a slight overshoot, so far, while /NG is currently testing another support level at 8.379 that I have on my 120-minute chart. Previous (Aug 30th) & updated 60-minute charts below.

NG 60m Aug 30th
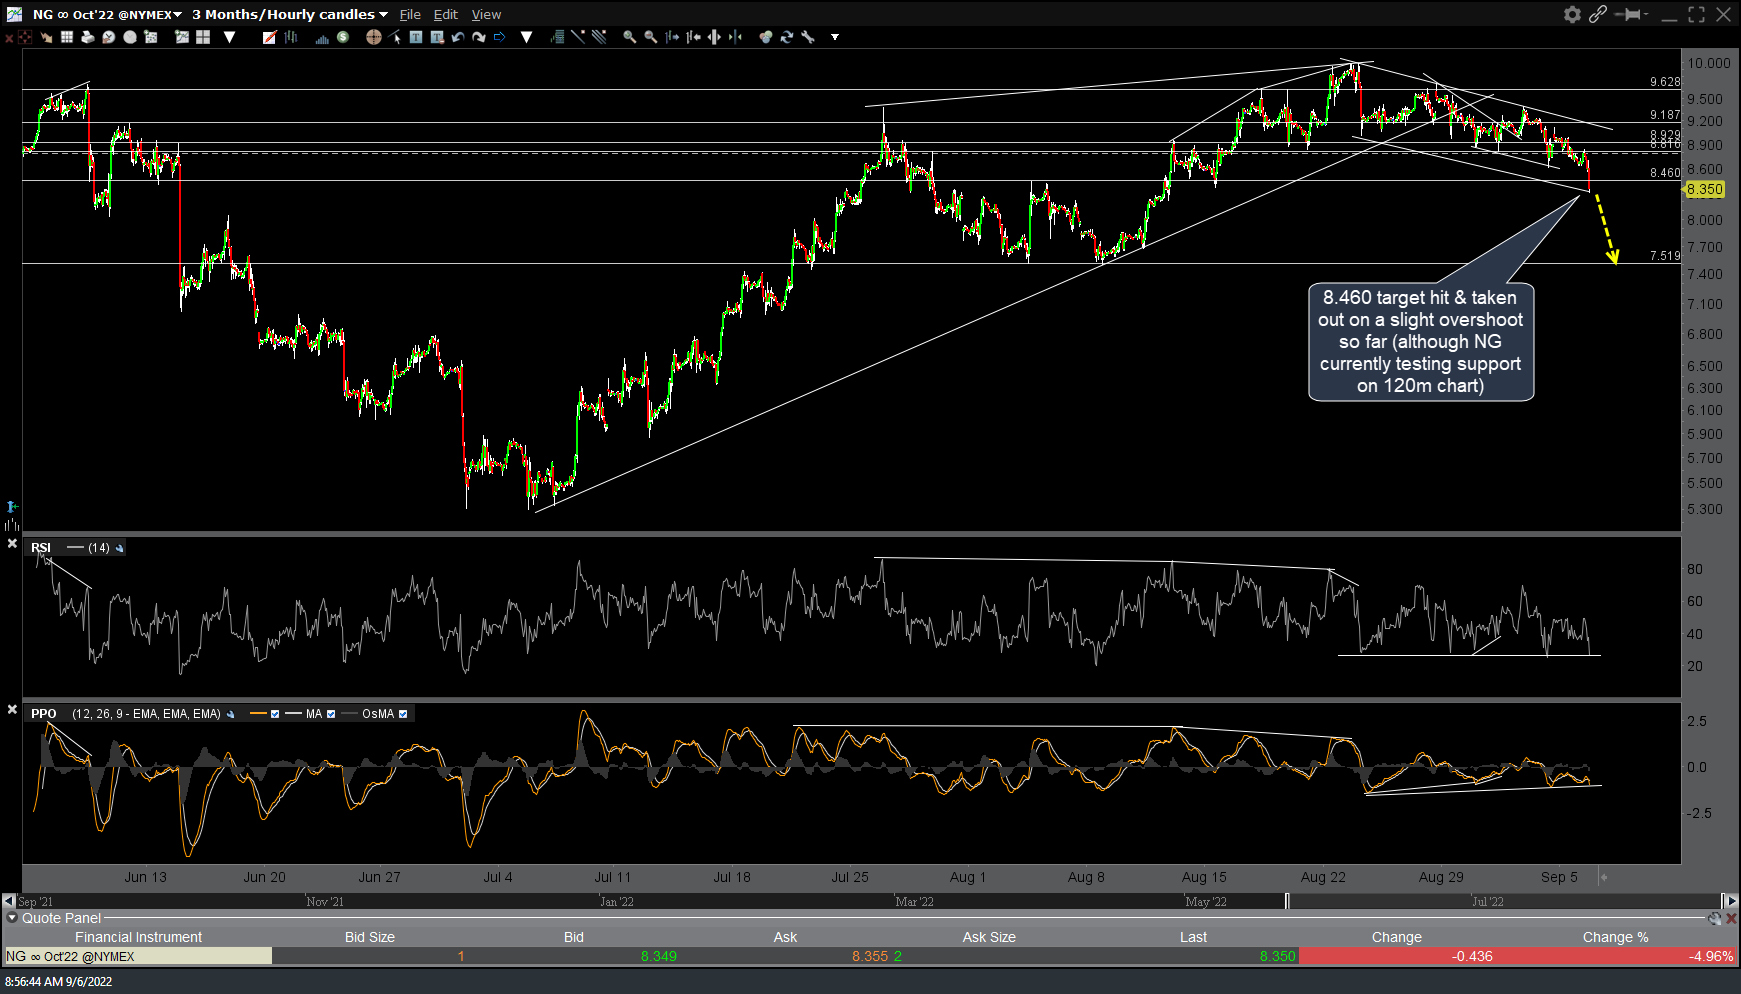
NG 60m Sept 6th
The chart below is the 6-month chart of /NG with 120-minute candlesticks which shows the 8.379 support level/alternative target that nat gas is currently testing on that time frame. While the odds for a reaction on this initial tag of support are elevated at this time, bounce or no bounce from here, it still appears that a move down to my next target around 7.519, roughly 11% lower, is still likely in the coming days to weeks.
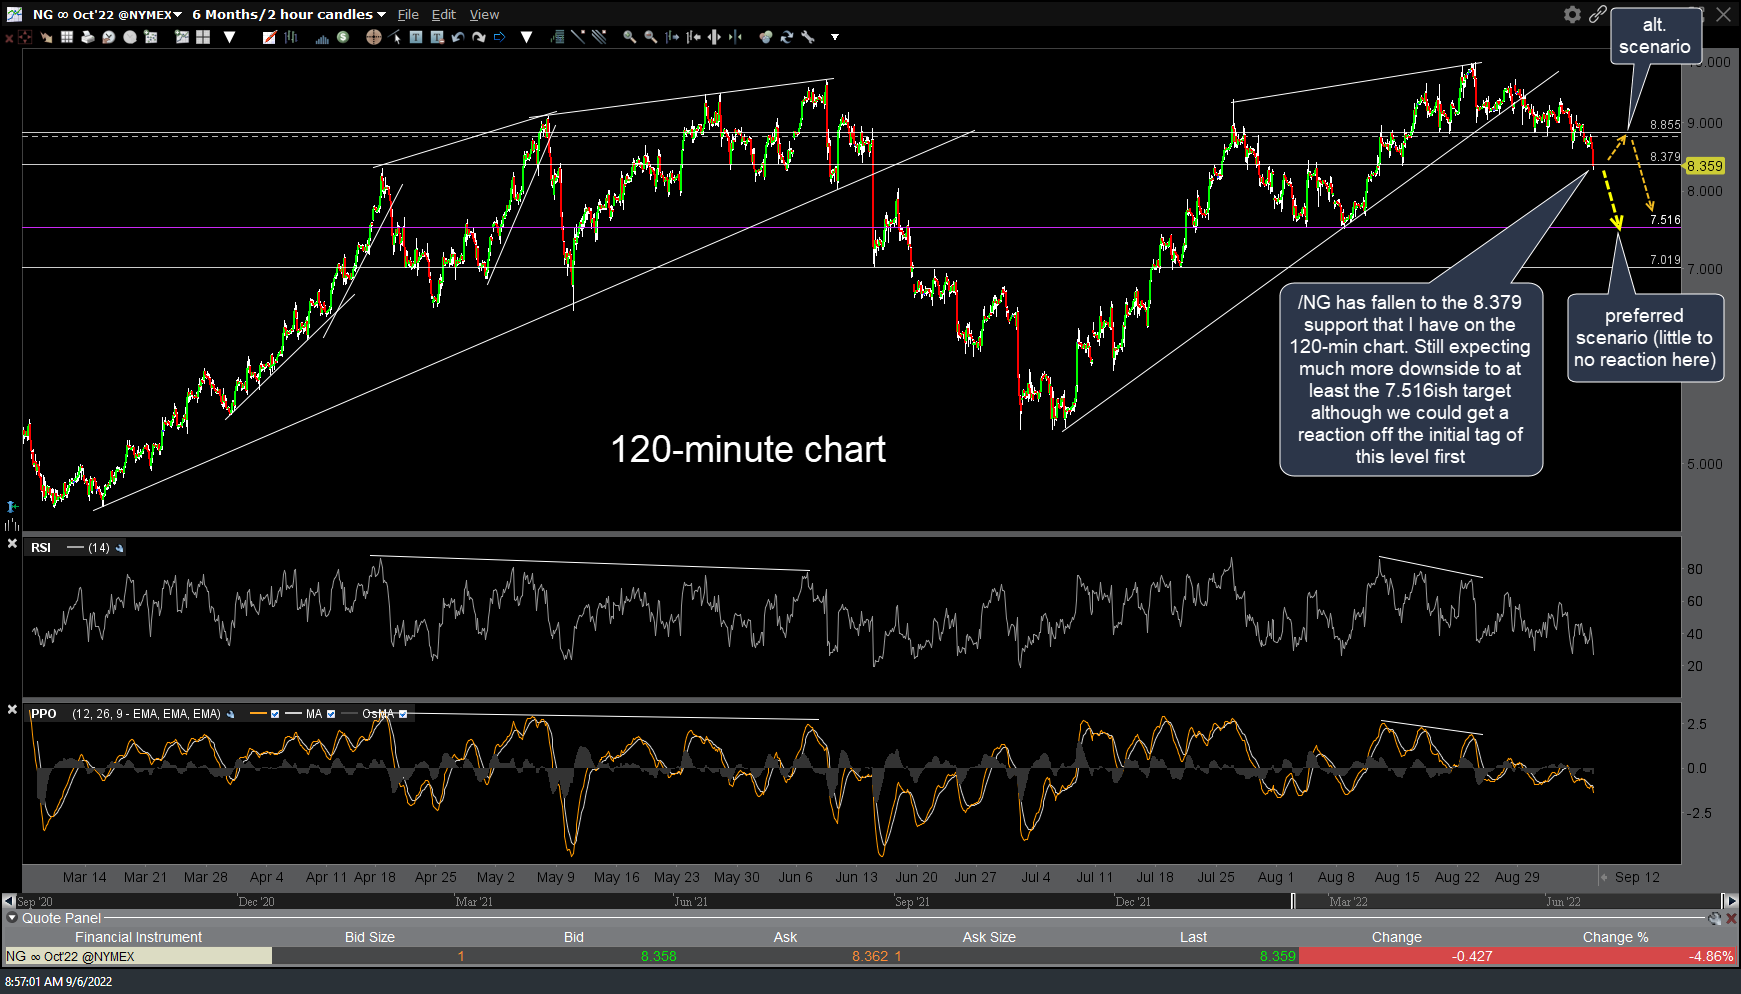
NG 120m Sept 6th
For those using the KOLD (-2x short nat gas ETN) alternative proxy, KOLD has already hit & taken out T1 & still appears likely headed to T2 and/or T3 in the coming days/weeks, following any reaction we may or may not get here at the support on /NG. Previous (Aug 29th) & updated 60-minute charts below.
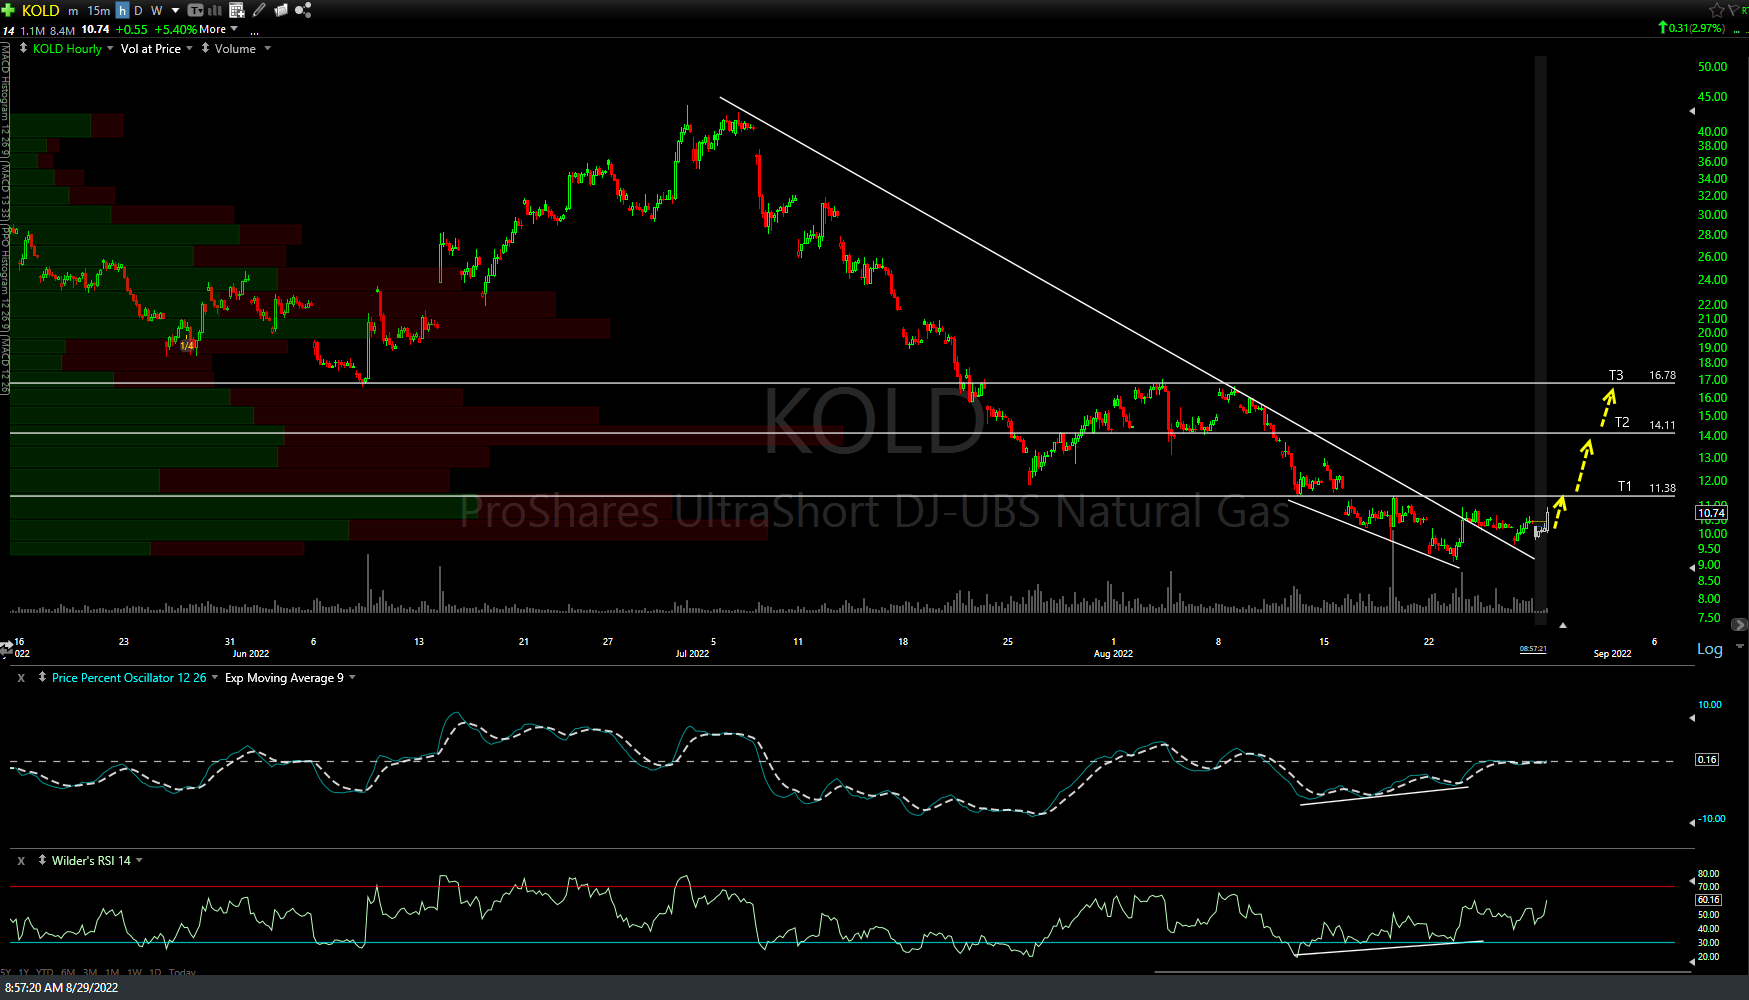
KOLD 60m Aug 29th

KOLD 60m Sept 6th
Keep in mind, this drop in nat gas from where it was trading last week when Russia had previously said it would turn the Nord 2 pipeline flows back on after the maintenance was completed on Saturday, the then later renigging on Friday under the G-7’s threat of capping Russian oil prices is quite bearish IMO, as nat gas continuing to fall despite the complete cessation of the Nord 2 pipeline flows to Germany speaks volumes about the current supply/demand dynamics.