
Both QQQ & /NQ formed potential bull flag continuation patterns on the 60-minute charts, as discussed as a potential scenario in last night’s market wrap video. However, the Nasdaq isn’t likely to breakout & run until at least the big, potentially market-moving economic reports that will be released at 8:30 am EST today; GDP & Jobless Claims.
A solid break above the QQQ 301 resistance level on this 60-minute chart will likely spark an impulsive rally up to T3 with potential rally start times at 8:30 and/or 9:30 am EST today. While I favor little, if any downside before & after the reports, any pullback to the uptrend line and/or 296.40 & 294 support levels will also offer objective long entries or add-ons to an existing long position (as would a solid break above the 301 resistance level), with stops somewhat below.
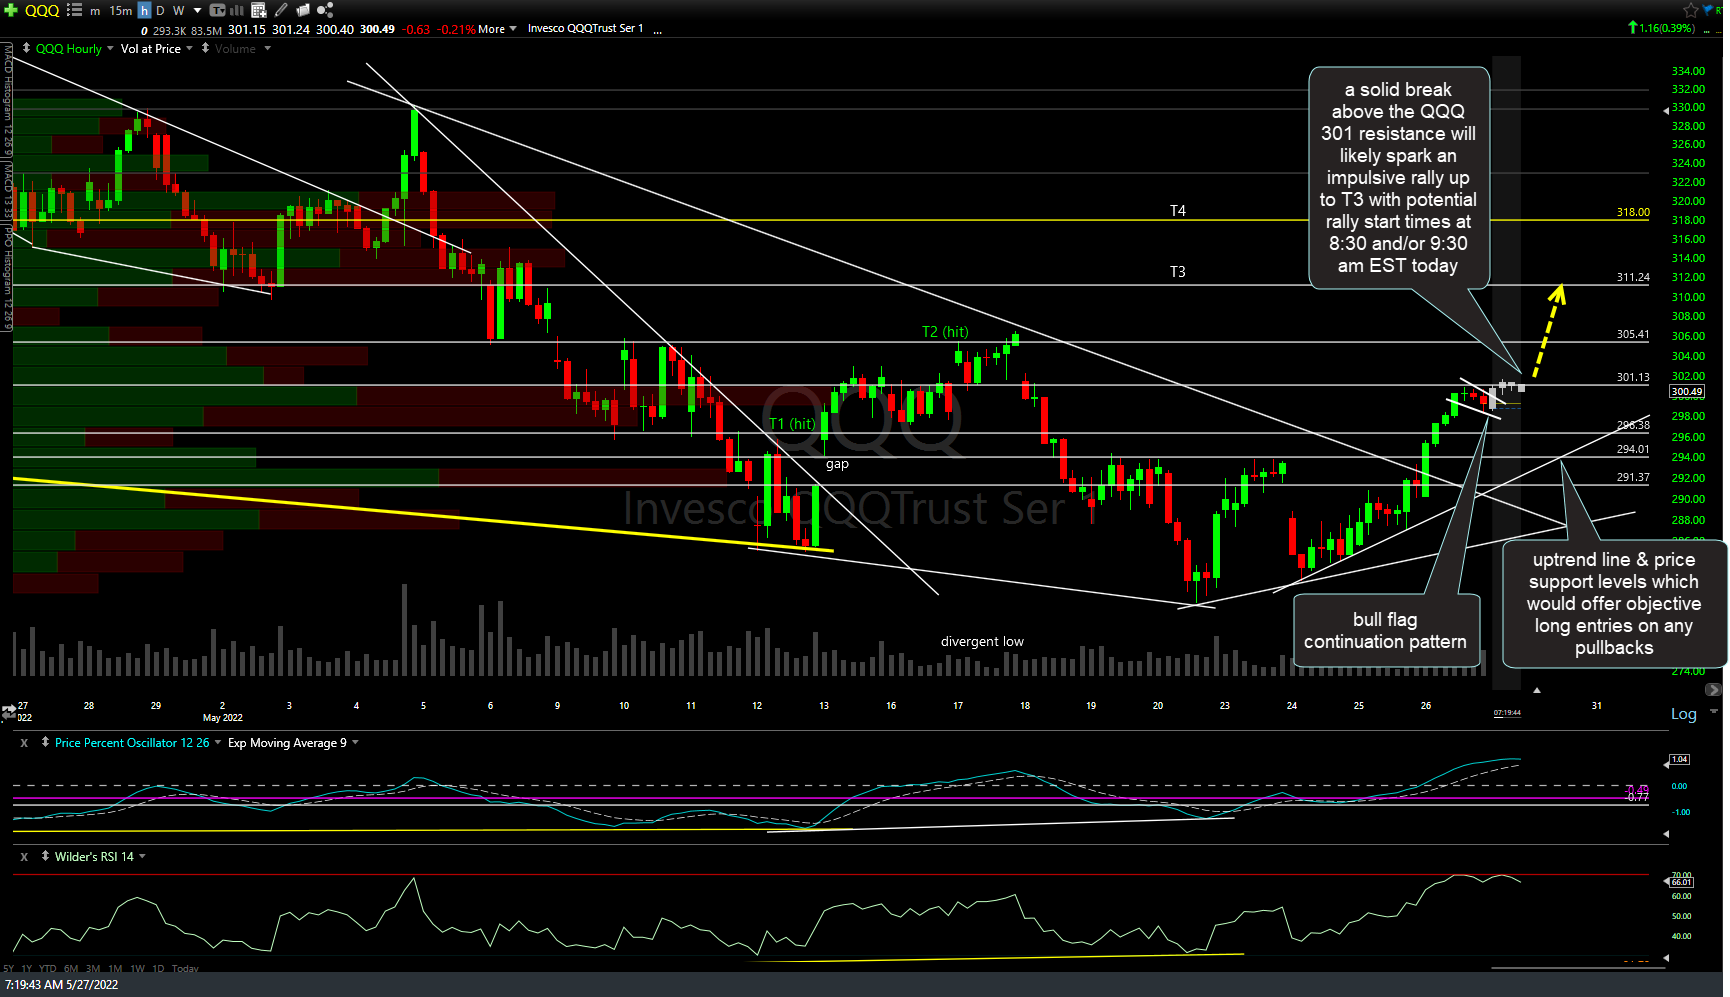
QQQ 60m May 27th
For futures traders, a solid break above the /NQ 12351ish resistance & downtrend line just above will likely spark an impulsive rally up to T2 although the stock futures will likely flounder around until the 8:30 am GDP report. Additionally, any pullback to the 12085ish former resistance, now support level as a very objective long entry or add-on, with stops somewhat below. 60-minute chart below.
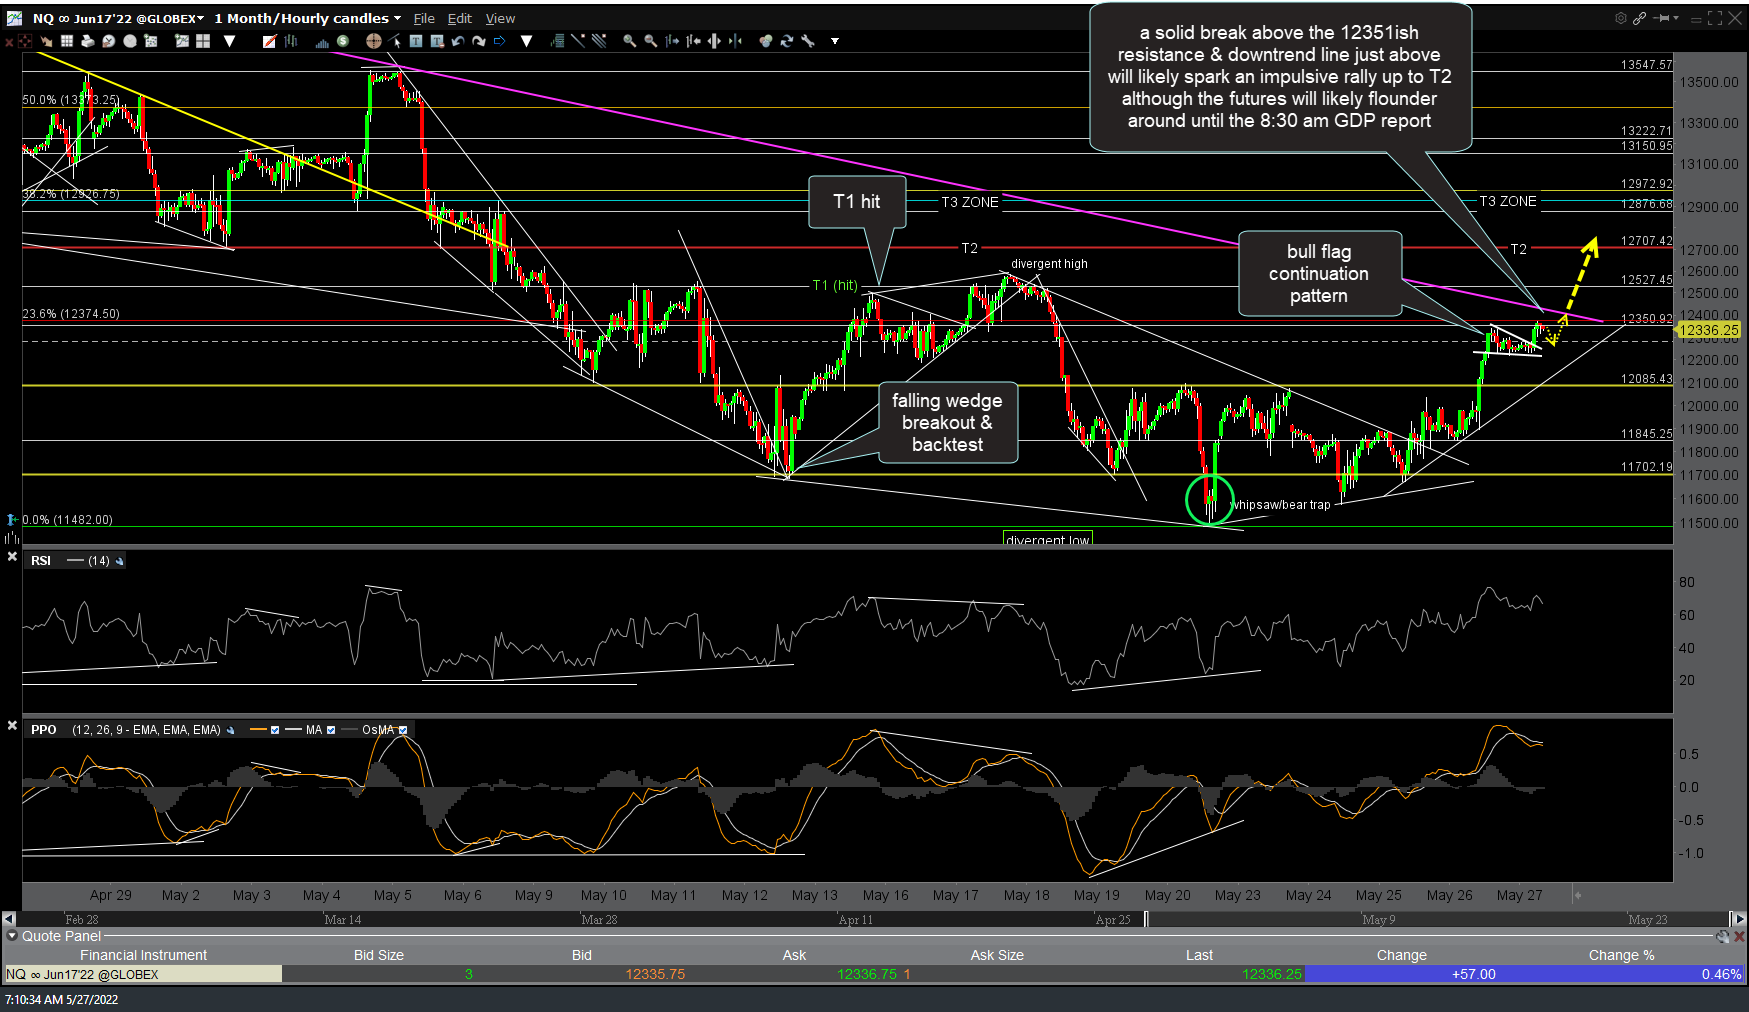
NQ 60m May 27th