
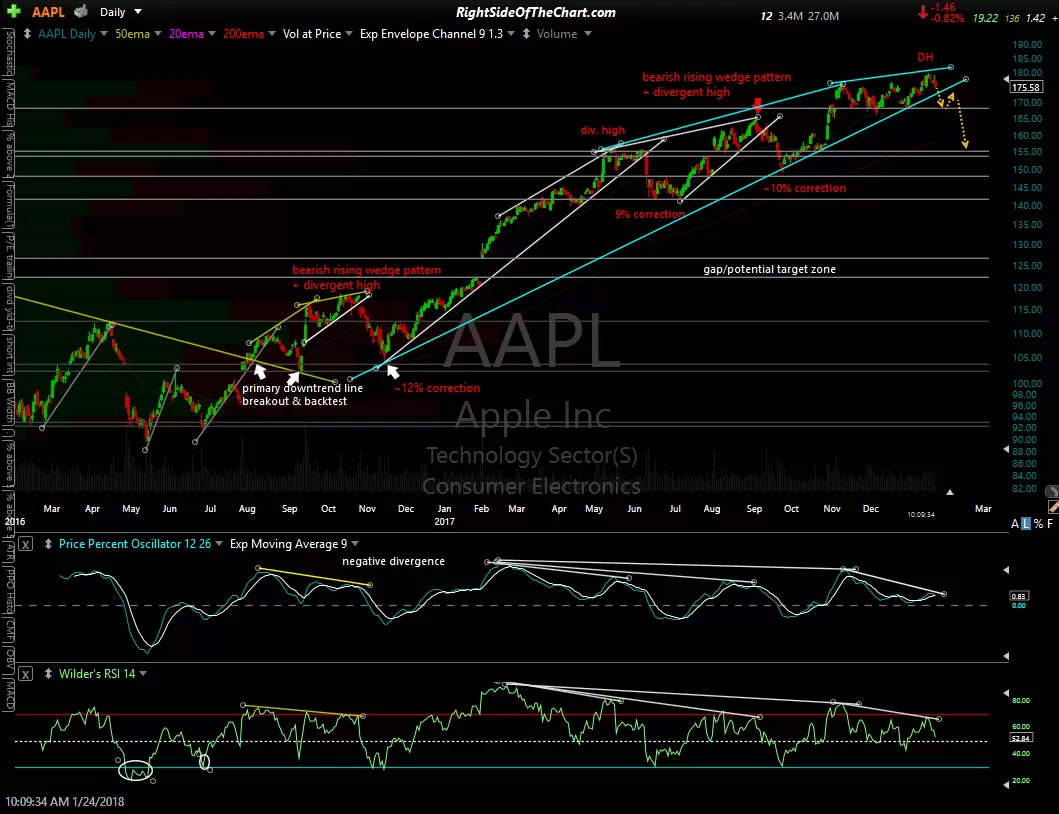
In the January 24th post titled AAPL Approaching Trendline Support, I had made the case for a correction in one of not the most beloved stocks right just before the climax of one the most powerful rallies in years while posted the first daily chart below stating the following:
Whether the initial reaction following earnings next week is a pop or a drop, my expectation is for a move down to at least the 155.50ish area in the coming weeks, which would constitute a drop of about 14% from the recent highs.
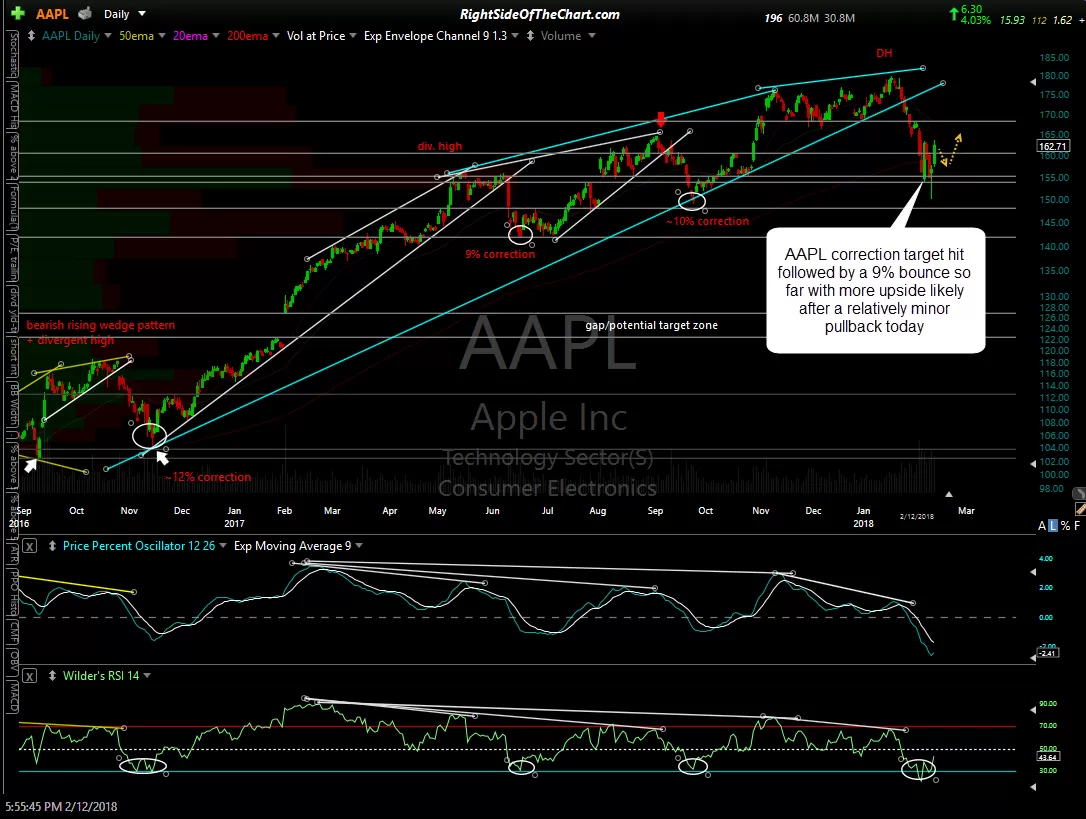
From there, Apple went on to break down below that critical uptrend line, falling over 16% with a brief momentum-fueled overshoot of my 155.50ish price target with several successful tests of that level before stock put in a divergent low on the 60-minute time frame (along with the broad market), rallying 9% off those lows so far. That rally has brought the stock back to the first significant resistance level, 163.89, at the highs yesterday which not by coincidence, coincided with the bottom of the first resistance zone that was posted on the SPY 60-minute chart in yesterday’s SPY Swing Trade Idea (Silver & Gold level access required to view that post).
-
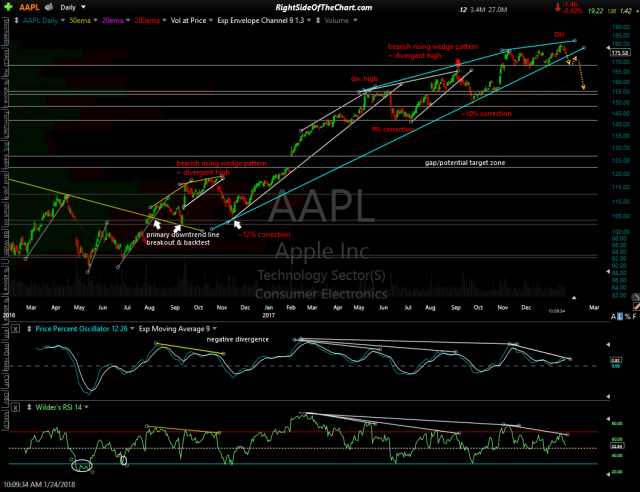
- AAPL daily Jan 24th
-
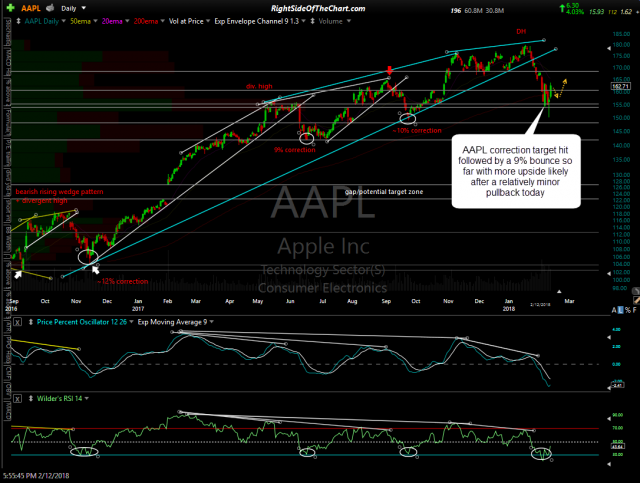
- AAPL daily Feb 12th
With both AAPL as well as the broad market hitting the first significant support level since bottoming on Friday, the reaction that just started as those levels were hit yesterday is likely to carry over into today, as the futures are currently indicating. However, I expect this pullback to be relatively minor & fleeting with a resumption of the near-term uptrend continuing this week as shown on the updated (as of yesterday’s close) 60-minute chart of AAPL below.
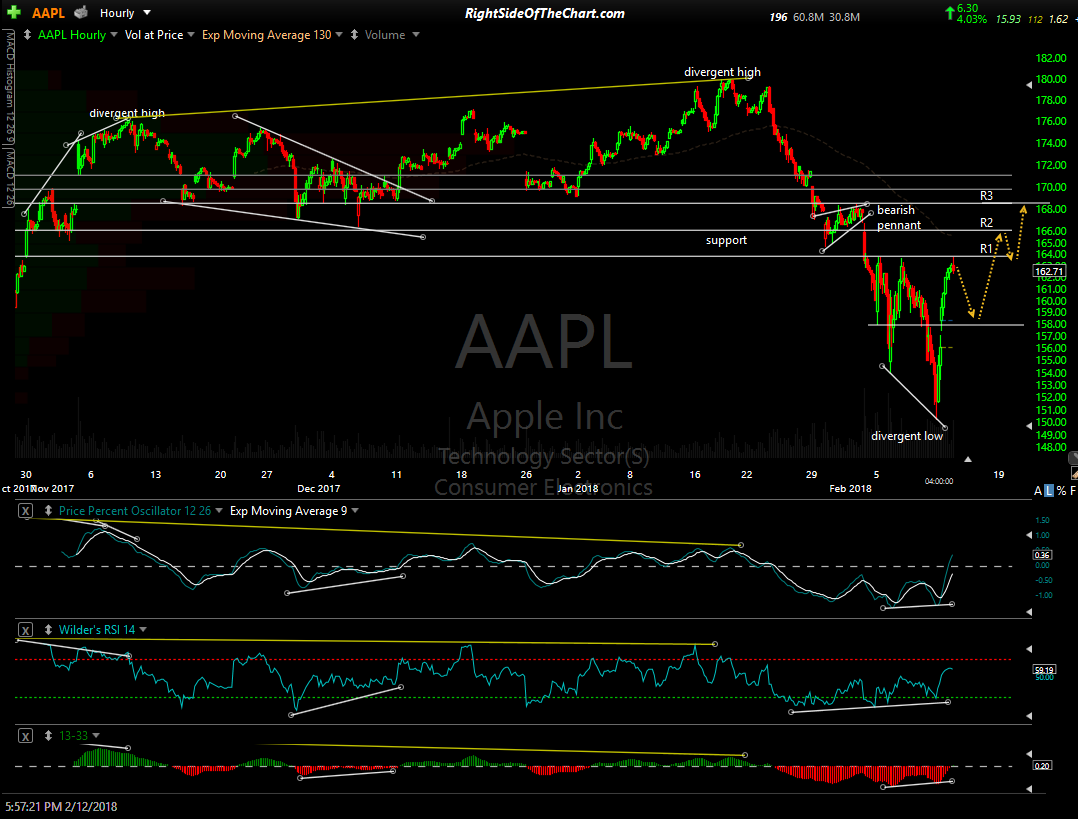
AAPL 60 min Feb 12th