
AAPL (Apple Inc.), the largest component of both the Nasdaq 100 & the S&P 500 has been lagging behind the broad market in recent days. More importantly, the stock is approaching the apex of this bearish rising wedge pattern, complete with negative divergences on the momentum indicators. With the stock scheduled to report earnings after the market close one week from today, I doubt that we’ll see any major fireworks in Apple before then & even if the stock were to trade below this primary uptrend line, positioning in front of earnings on a stock with a history of fairly large earnings-induced gaps entails a fair amount of risk. Whether the initial reaction following earnings next week is a pop or a drop, my expectation is for a move down to at least the 155.50ish area in the coming weeks, which would constitute a drop of about 14% from the recent highs.
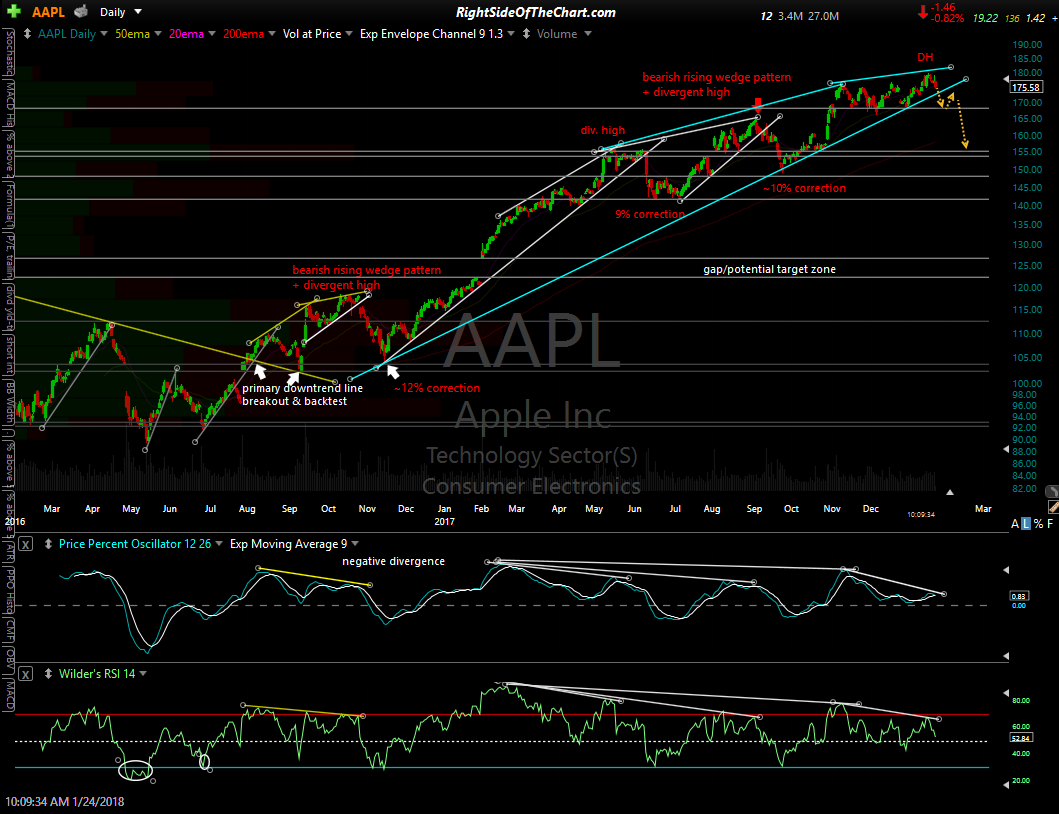
AAPL daily Jan 24th
I realize that most traders & investors aren’t interested in potential short setups right now with the market in melt-up mode, especially on a beloved stock like Apple but the charts are the charts & if I didn’t post what I saw then I wouldn’t be doing my job. The weekly (6-day candles) chart below show the history of overbought readings & divergent highs and the subsequent corrections in AAPL as well as the oversold readings & divergent lows that preceded major rallies in the stock.

AAPL weekly (6-day) Jan 24th