
A video covering the equity markets & energy sector will be posted shortly but until then, I wanted to share these intraday charts (10-minute & 60-minute) of /NQ (Nasdaq 100 futures). On the 10-minute chart below, a solid recovery back above /NQ 11275 has the potential to trigger a short-covering rally & could have intermediate-term (weeks+) bullish implications. Until & unless that happens, today’s break below that level (and the previous spike low) is bearish while a break of today’s low (~11130) would likely seal the deal on today’s earlier sell signal.
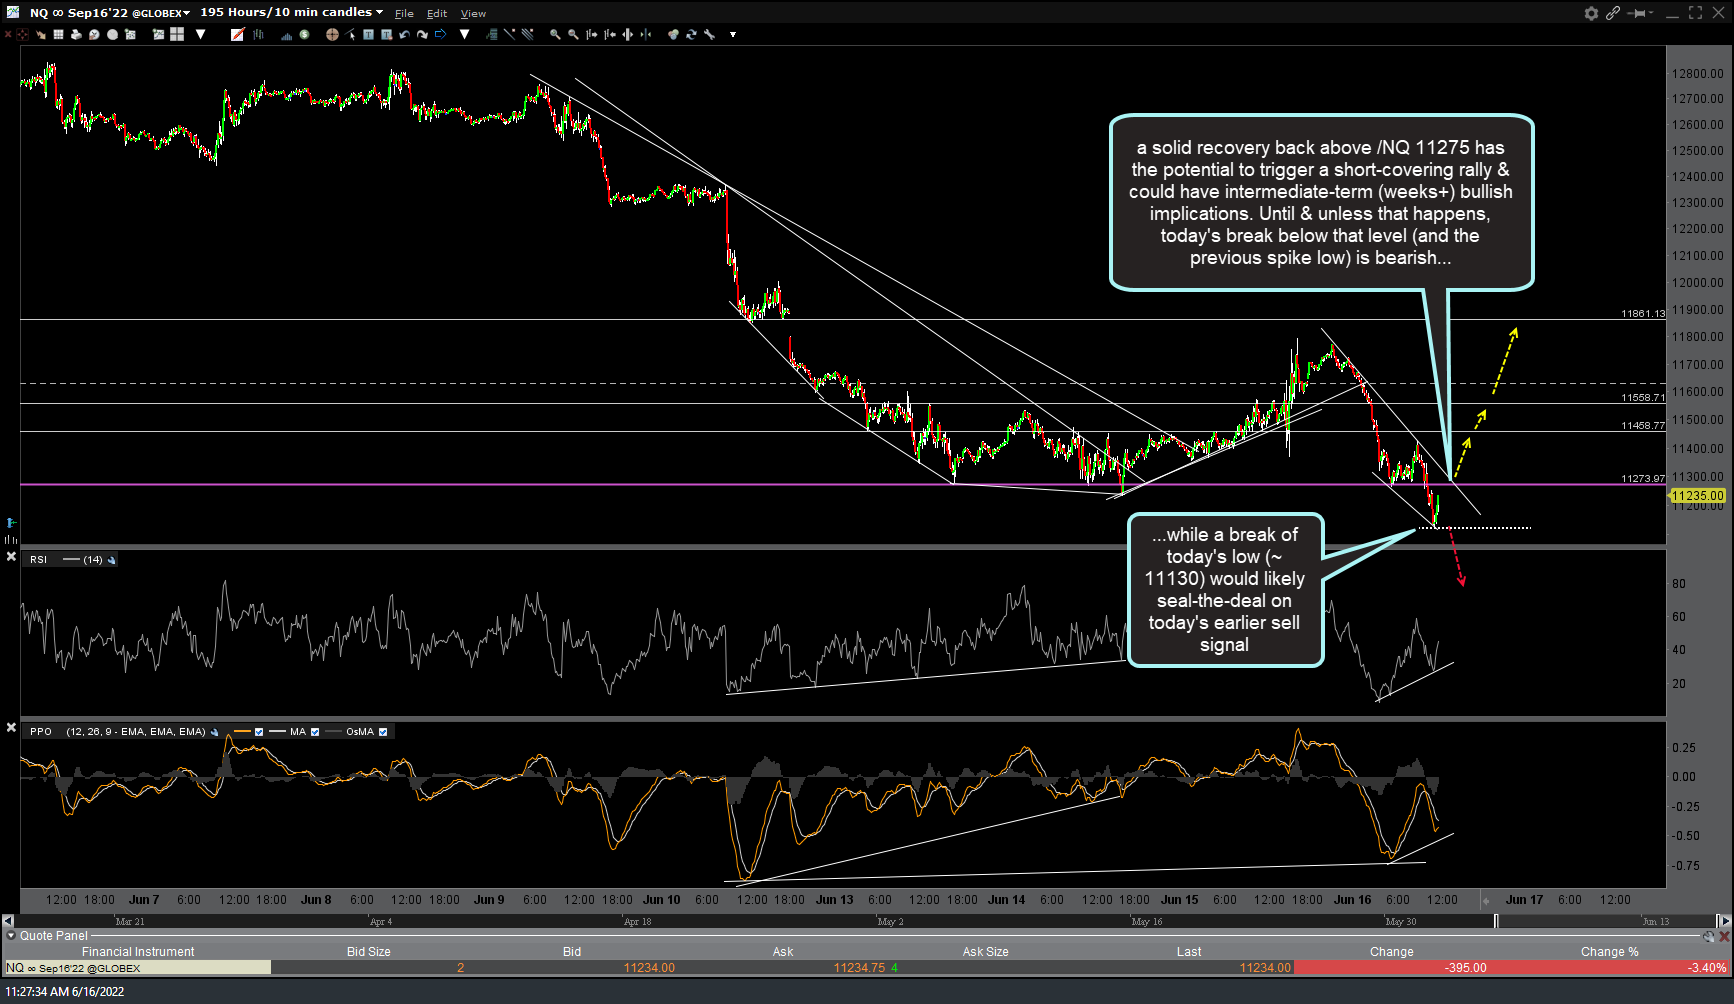
NQ 10m June 16th
As of now, today’s earlier breakdowns/sell signals are still intact although this one has the potential to go either way & should today’s breakdowns prove to be a whipsaw/bear trap, we could see those potential positive divergences on the 60-minute (below) and daily charts firmed up. Should the Nasdaq continue lower with the divergences being negated (taken out), that would increase the odds that we cut through my third target on the weekly chart of QQQ & continue down to the final target (T4), quite likely in an impulsive manner. Stay flexible & nimble.
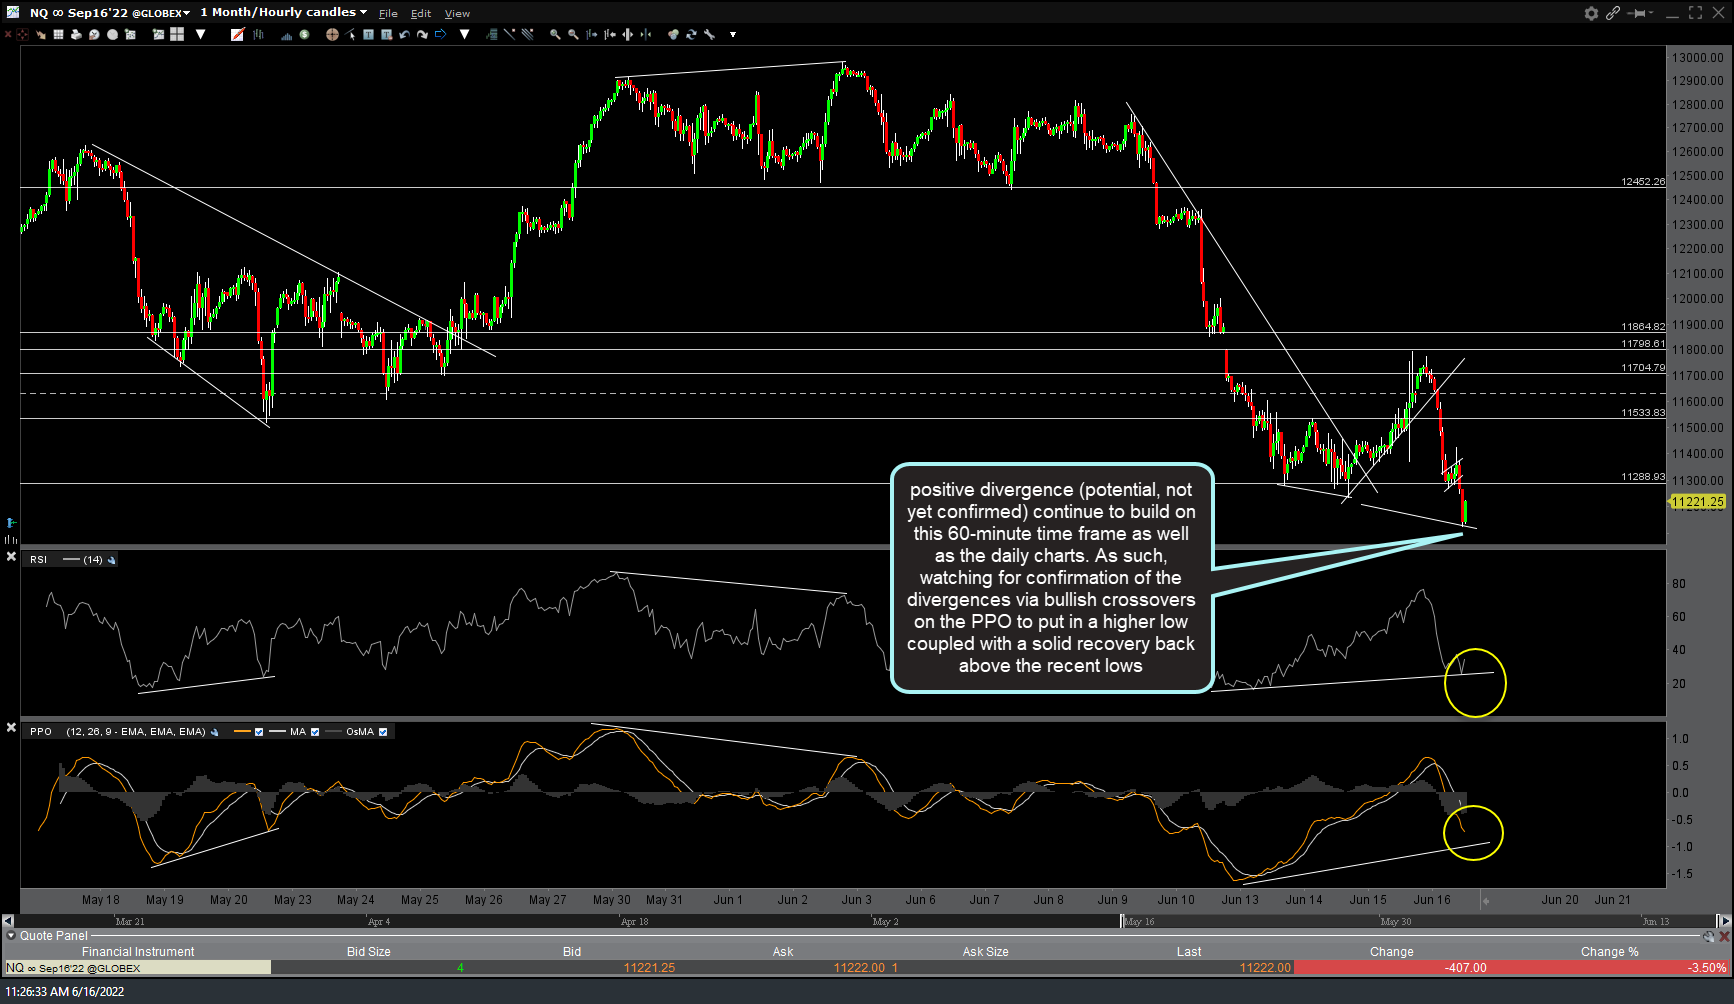
NQ 60m 2 June 16th