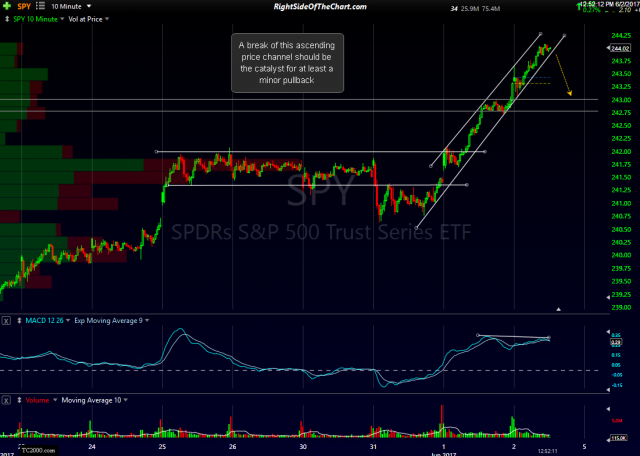
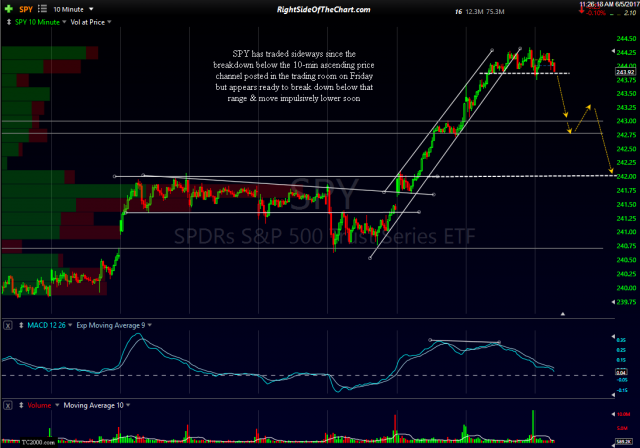
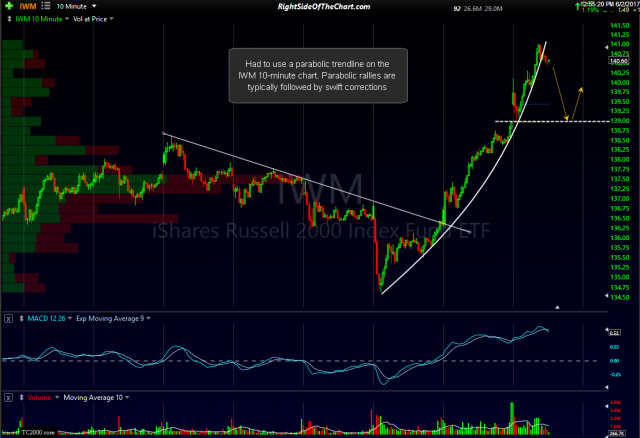
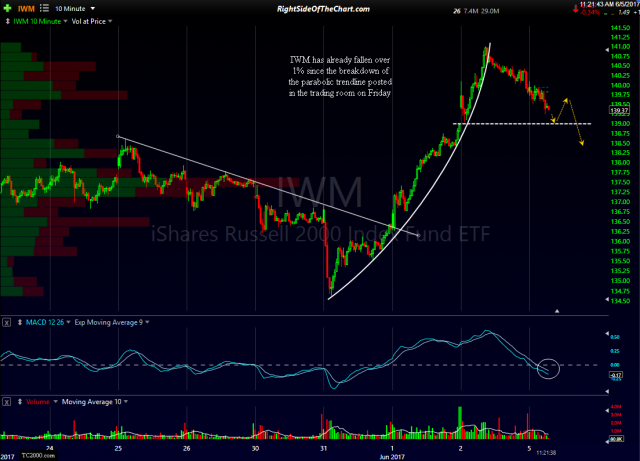
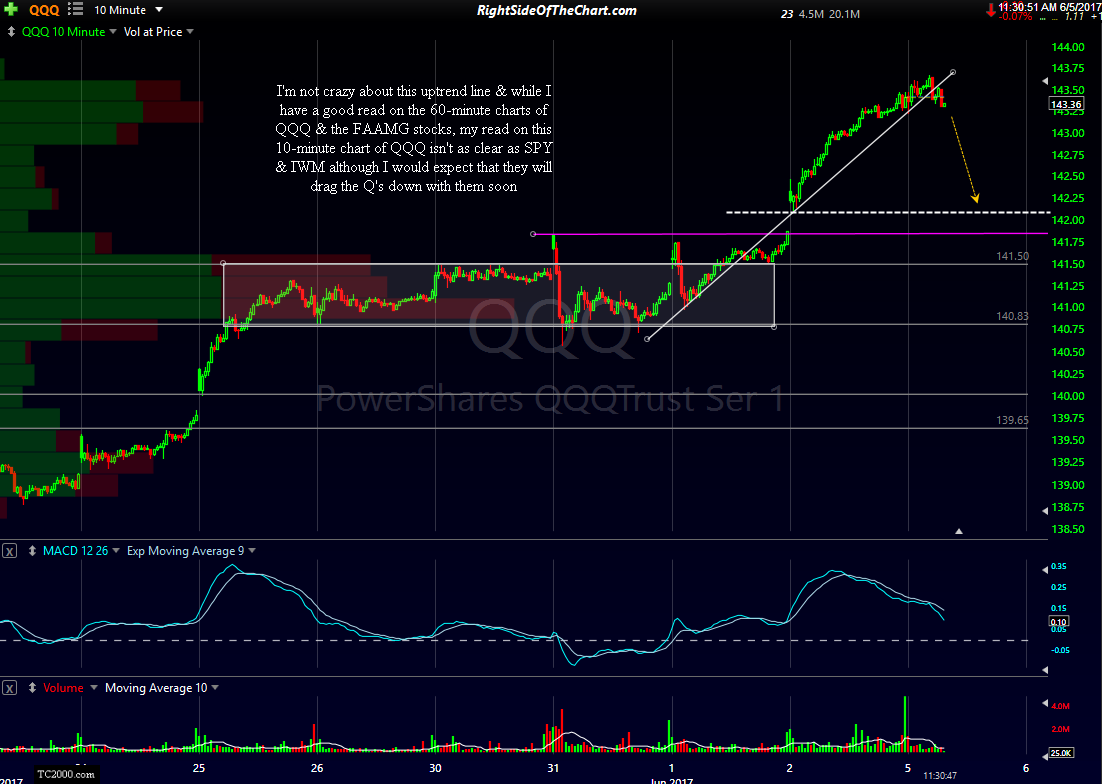
Here’s a look at the 10-minute charts on SPY, IWM & QQQ as well as the previous 10-minute charts on SPY & IWM that were posted in the trading room on Friday.
SPY has traded sideways since the breakdown below the 10-min ascending price channel posted in the trading room on Friday but appears ready to break down below that range & move impulsively lower soon.
- SPY 10-min June 2nd
- SPY 10-minute June 5th
IWM has already fallen over 1% since the breakdown of the parabolic trendline posted in the trading room on Friday & will likely hit that near-term pullback target soon where the odds for a reaction are decent but largely dependent on where the large caps (SPY, QQQ, DIA) are trading at the time.
- IWM 10-min June 2nd
- IWM 10-minute June 5th
I didn’t post a 10-minute chart of QQQ on Friday as I’m not crazy about this uptrend line & while I have a good read on the 60-minute charts of QQQ & the FAAMG stocks, my read on this 10-minute chart of QQQ isn’t as clear as SPY & IWM although I would expect that they will drag the Q’s down with them soon. The chart patterns & technical developments on the QQQ 60-minute time frame & especially the 60-minute charts of the market leading FAAMG stocks are so clear that I plan to follow up with those charts soon, possibly in video format.


