
Member @everbank7 asked for my thoughts on GD (General Dynamics Corp) and GS (Goldman Sachs Group Inc). While these two stocks are in completely different industries, they do share some similarities regarding their technical postures; near-term bullish & long-term bearish.
I decided to share my reply here on the front page for all to see for a couple of reasons. First, both of these trades might offer a swing trade on the long side in the coming weeks to months as well as a potential shorting opportunity, if/as any counter-trend rally runs it course & the charts confirm a short entry (or exit on a long position) at the time. I also think these two stocks are a good example of using multiple time frames when analyzing a stock to help determine both the short-term as well as the longer-term outlook for the stock.
Starting with the longer-term outlook for GD, while this most recent ~20% drop following the March/April ’18 divergent high rivals the ~21% drop following the divergent high back in Aug ’15, the fact that GD has now broken below the primary (yellow) uptrend line should have longer-term bearish implications. One potential scenario would be a counter-trend rally to backtest that trendline from below before GD begins the next major leg down.
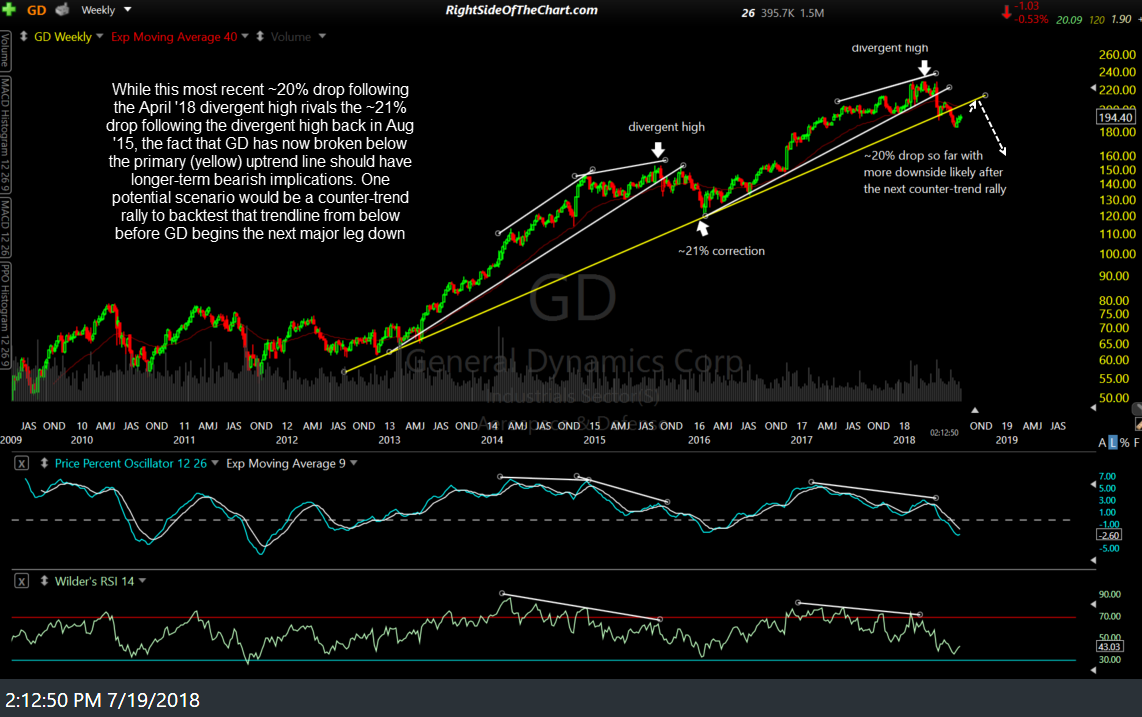
GD weekly July 19th
Zooming down to the daily chart, GD recently put in a divergent low, which is bullish, following that ~20% drop off the March & divergent highs (which was a clear sign that an impending trend change was likely at the time). However, divergent highs & lows by themselves are not buy & sell signals.
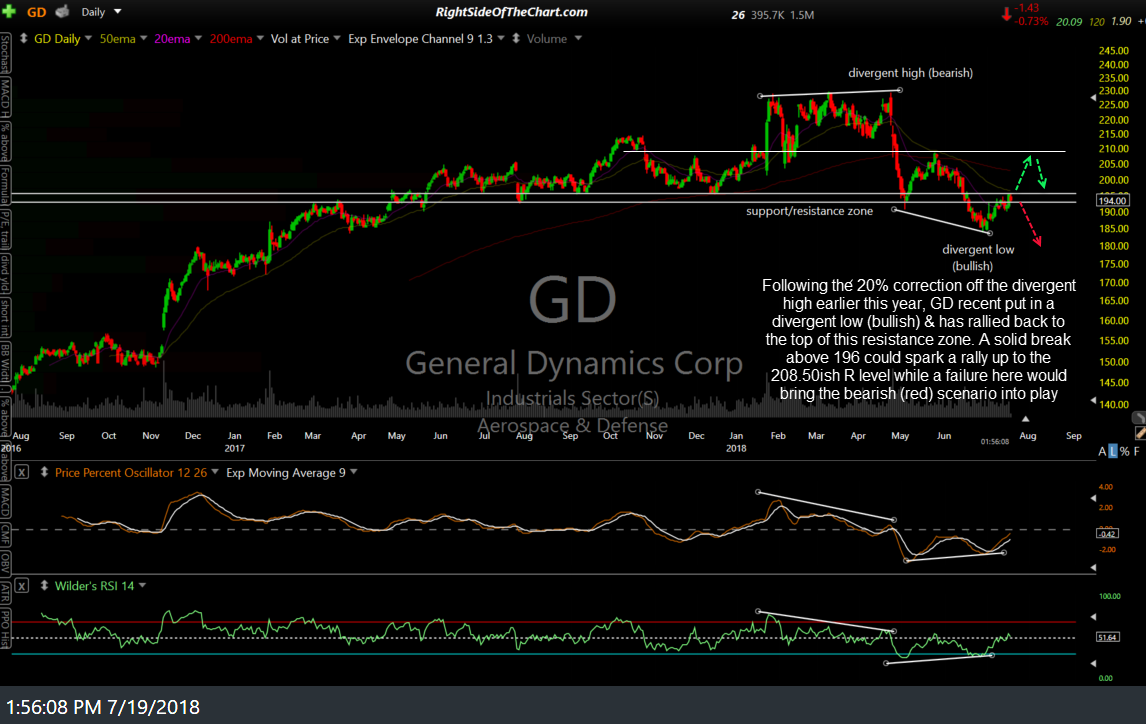
GD daily July 19th
While GD has rallied over 6% off the June 28th divergent low, it is now up against the top of a resistance zone that comes in around 196.00. As such, the next objective long entry/buy signal will come on an impulsive breakout above 196 but until & unless that happens, it is certainly possible that this oversold rally into resistance could mark the end of the 2nd counter-trend rally since GD put in a triple-top earlier this year. Should GD take out 196 with conviction, my price targets would be the 208.50ish resistance and/or a backtest of the primary uptrend line on the weekly chart, whichever comes first. If GD fails to break above 196 & run, that could spark the next major leg down in the stock.
Like GD, GS recent broke down below a multi-year trendline on the weekly time frame following the most recent divergent high back in March, with GS falling ~20% into support so far, compared to a ~37% drop off the June ’15 divergent high.
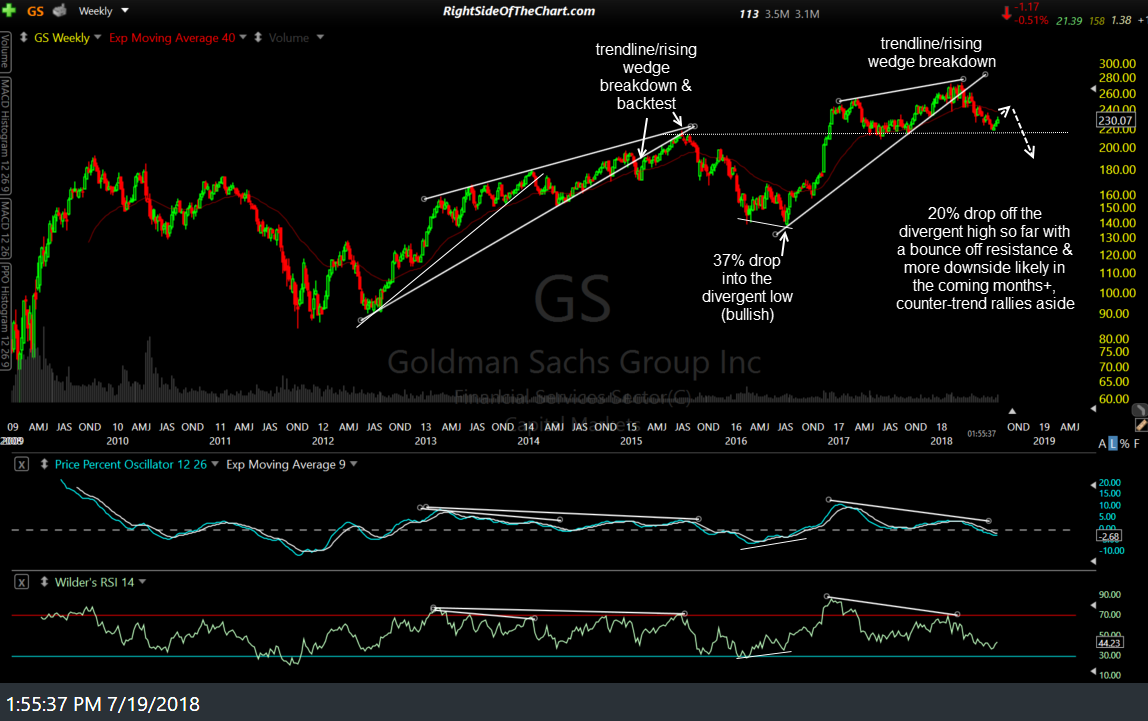
GS weekly July 19th
Zooming down to the daily time frame, GS has been highlighted in recent videos along with the other major financial stocks as some of the more bullish setups this week. GS recently broke above this bullish falling wedge pattern after putting in a divergent low & could run up to any or all of the overhead resistance levels shown below.

GS daily July 19th
While the recent divergent low & breakout in GS as well as the rest of the big financials is certainly bullish on face value, it is worth noting that the PPO signal line (9-ema) is below the zero line, indicating that the trend is currently bearish. Should the signal line remain below zero, this could prove to be a sucker’s rally (white arrows show the previous bullish & bearish zero-line crosses on the PPO signal line- note the subsequent price action above).