
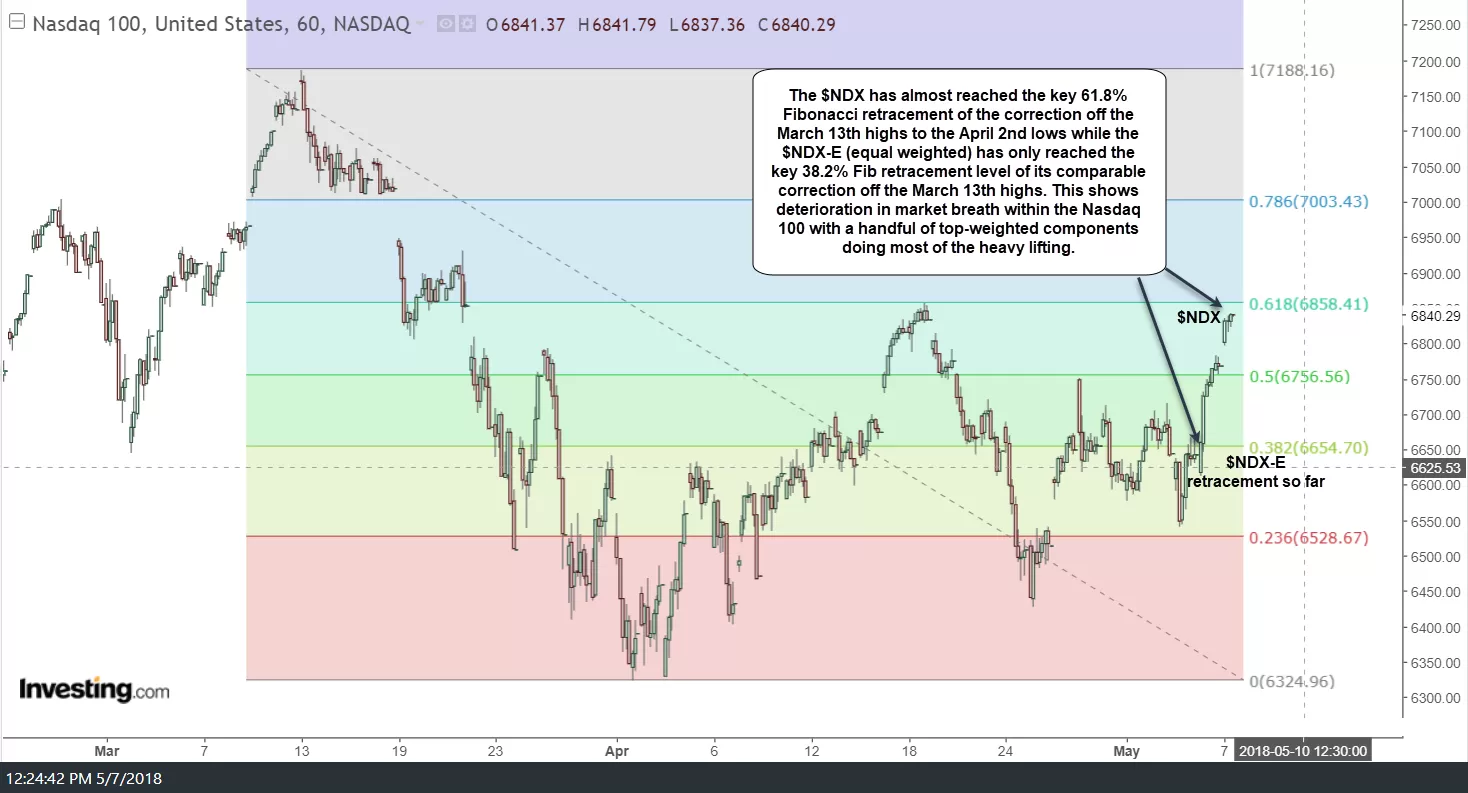
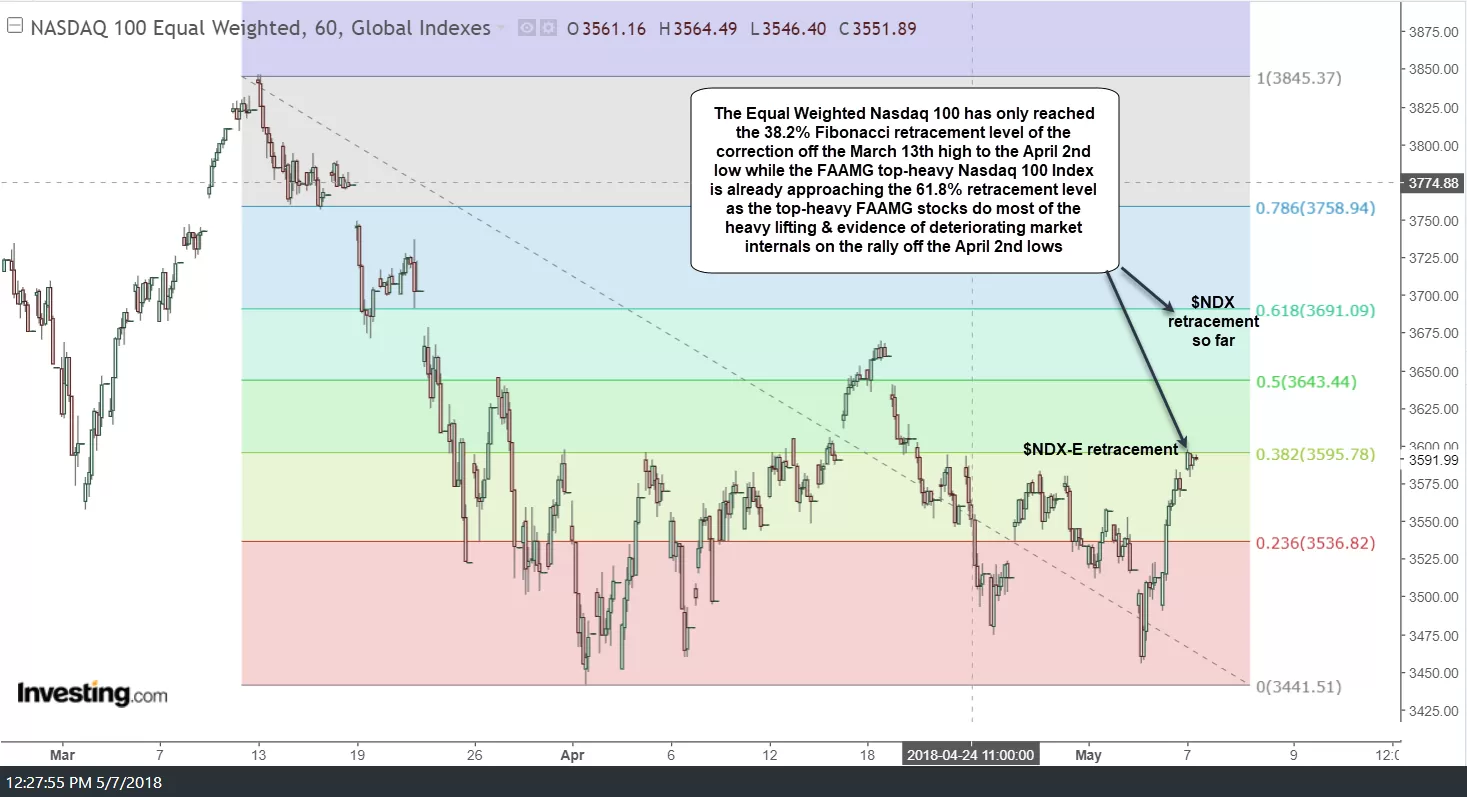
The $NDX has almost reached the key 61.8% Fibonacci retracement of the correction from the March 13th highs to the April 2nd lows while the $NDX-E (equal-weighted Nasdaq 100) has only reached the key 38.2% Fib retracement level of its comparable correction off the March 13th highs. This shows deterioration in market breadth within the Nasdaq 100 with a handful of top-weighted components (the FAAMG stocks plus a few others) doing most of the heavy lifting.
-
- $NDX 3-13 to 4-2 Fibs May 7th
-
- $NDXE 3-13 to 4-2 Fibs 5-7-18
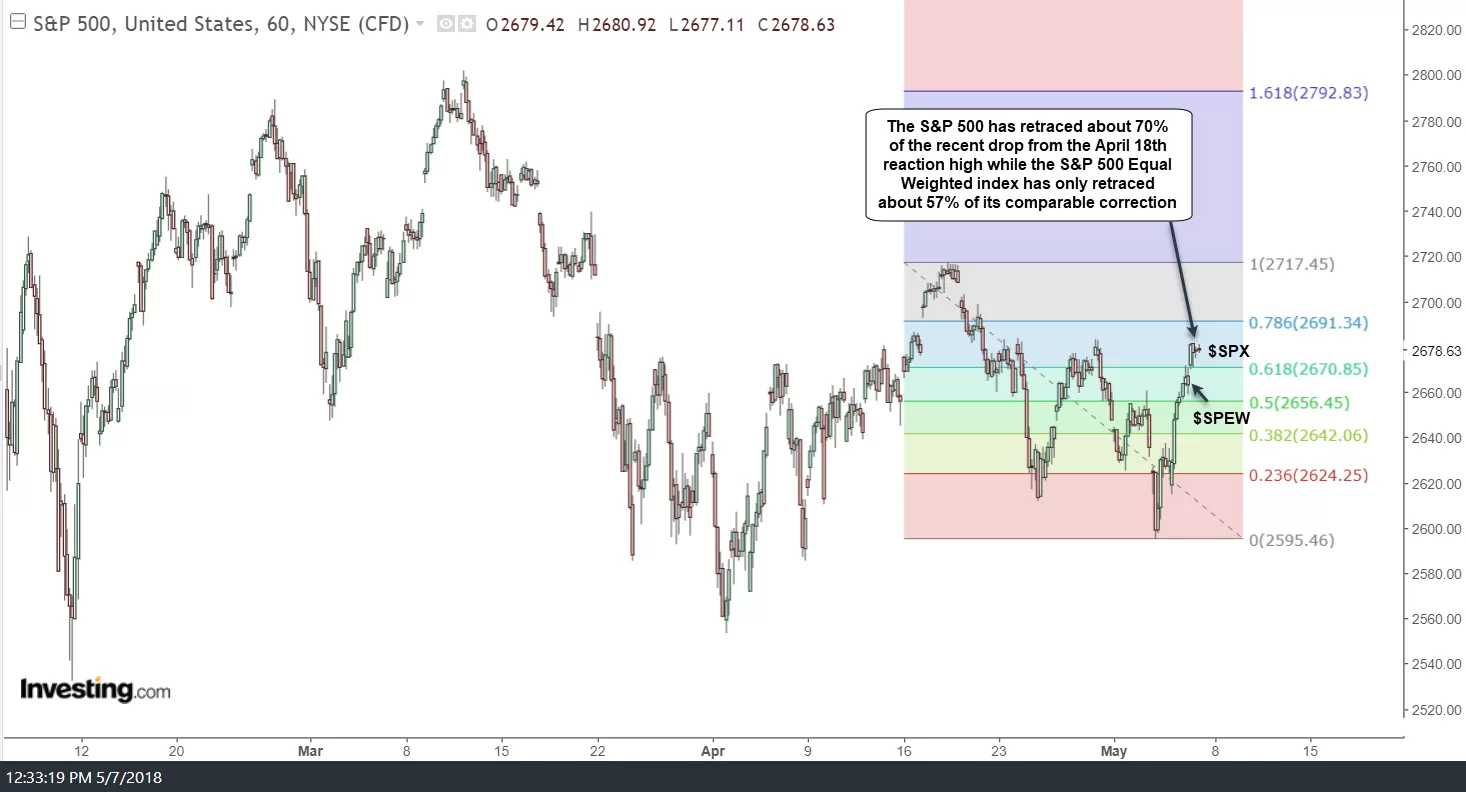
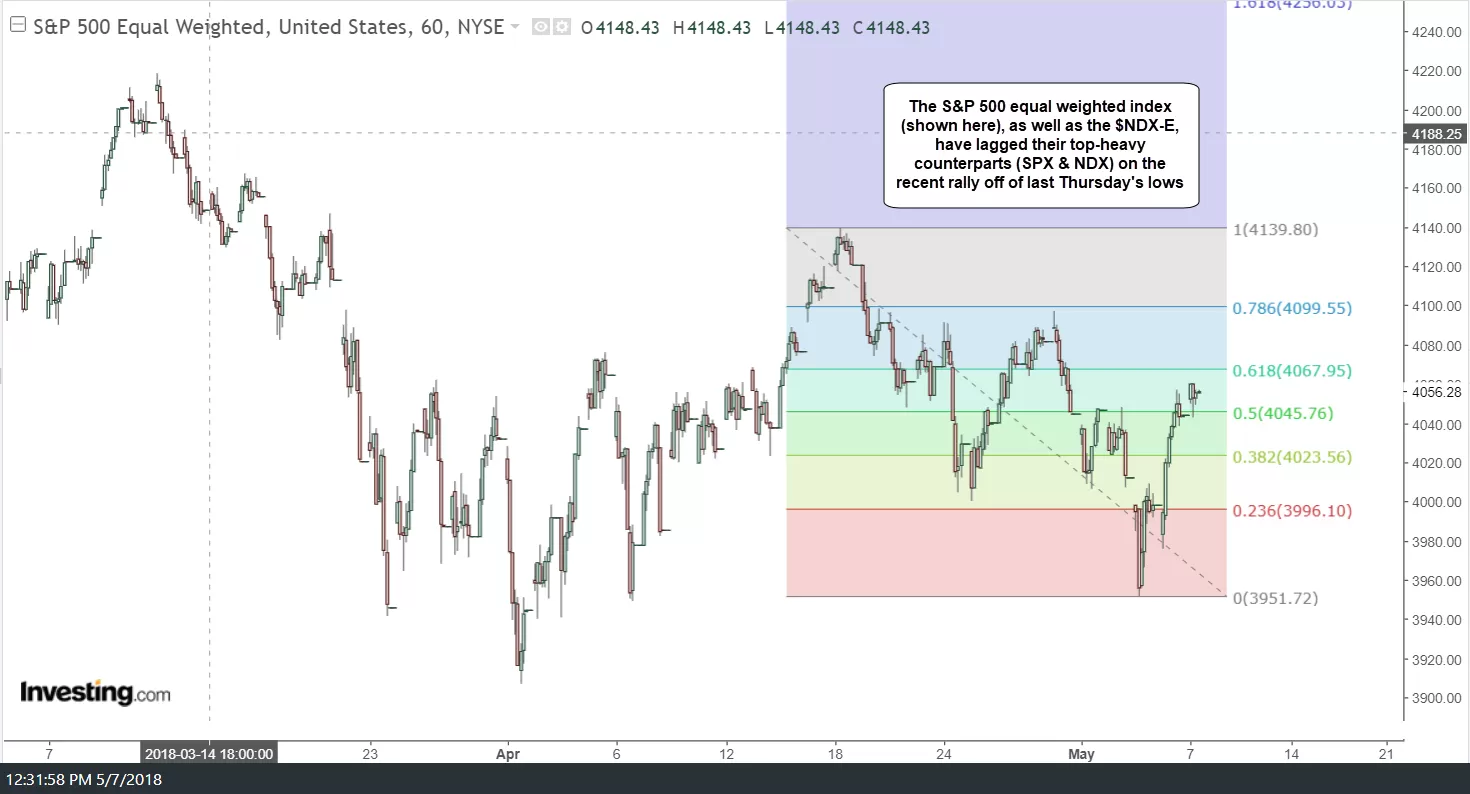
The differential between the retracements of the same corrections between the S&P 500 & the S&P 500 equal-weighted indexes were not as pronounced, as the top components of the S&P 500 Index aren’t as nearly as over-weighted as those of the Nasdaq 100 although the underperformance of the equal-weighted S&P 500 index vs. the regular S&P 500, especially on the most recent advance off the May 3rd low can also be viewed by adding Fibonacci retracement levels to the drop from the April 18th reaction high to that previous low last Thursday. The divergence between the $NDX & the $NDX-E over that same time period is even more pronounced.
-
- $SPX 4-18 to 5-3 Fibs May 7th
-
- $SPEW 4-18 to 5-3 Fibs May 7th
Bottom line: These charts indicate that a large part of the recent advance in the stock market has been attributed to a relatively small percentage of top-weighted stocks in the major large-cap indices. While this could prove to be a temporary occurrence, such deterioration in underlying market breadth is usually a warning sign that all is not well under the hood during a stock market advance.