
In the comment section below today’s Index & Sector Analysis video, in which I briefly touched on natural gas, member @murphydoc inquired: ‘So is Nat gas a buy? What would be your target?’
Although I’m personally long nat gas, I decided not to add it as an official trade idea because I’d prefer to see the charts firm up a bit more before doing so. Although my entry was based on what I think was a sound technical case, it was most certainly an aggressive, ‘catch-a-falling-knife’ trade. Fortunately, or at least so far, I was able to go long right at the lows yesterday, with that entry & reasoning behind it posted here in trading room: http://rightsideofthechart.com/members/pkm48193/activity/22561/#acomment-22562 ). I also would like to thank several other members, including @pkm48193, @joefriday & others that for keeping nat gas on my radar with their recent analysis & updates on nat gas within the trading room.
That entry yesterday was and still is based on attempting to catch a possible bottom or at least play an “oversold, off support” bounce trade and so far so good. /NG (nat gas futures) hit a low of 2.522 right around the time I made that post in the trading room yesterday but it is still too early to say that the bounce off that 2.55-2.50 support level is anything more than a dead-cat bounce at this point.
-

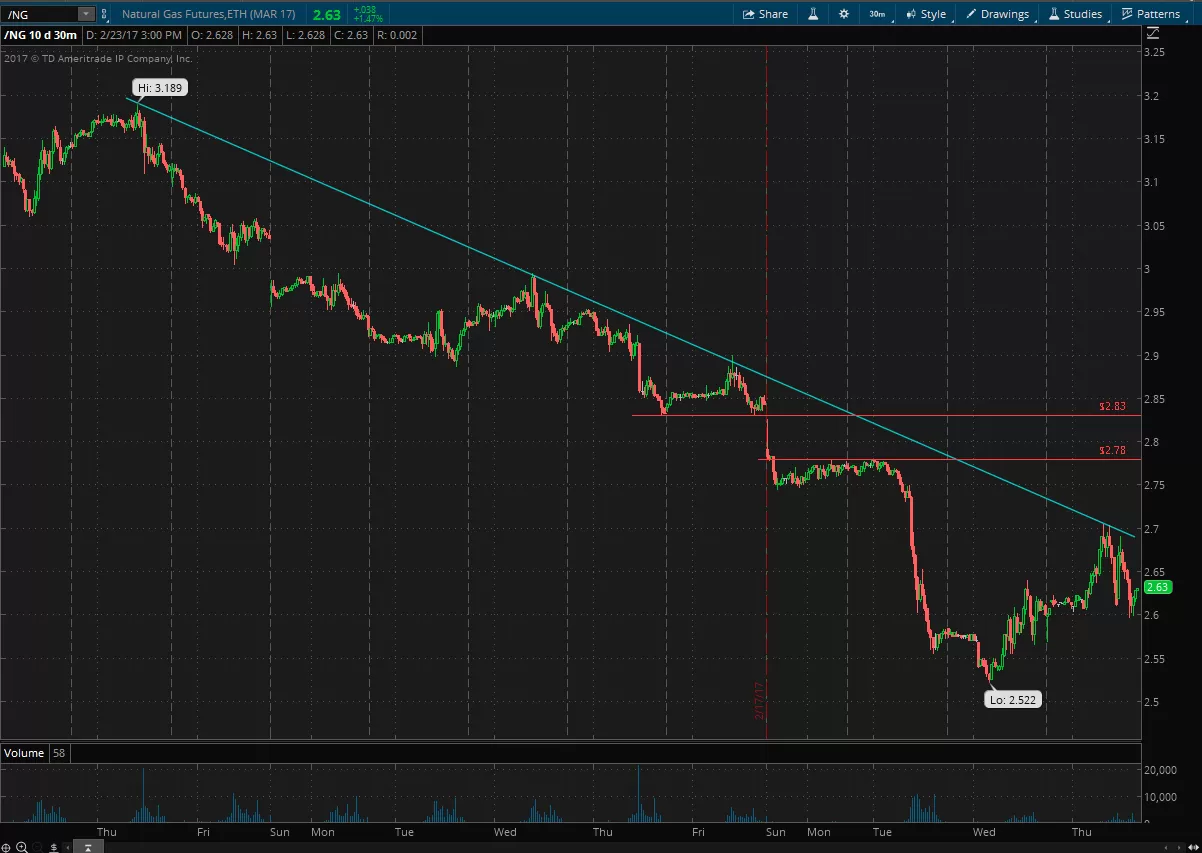
- $NG 60-min Feb 23rd
-

- $NATGAS daily Feb 23rd
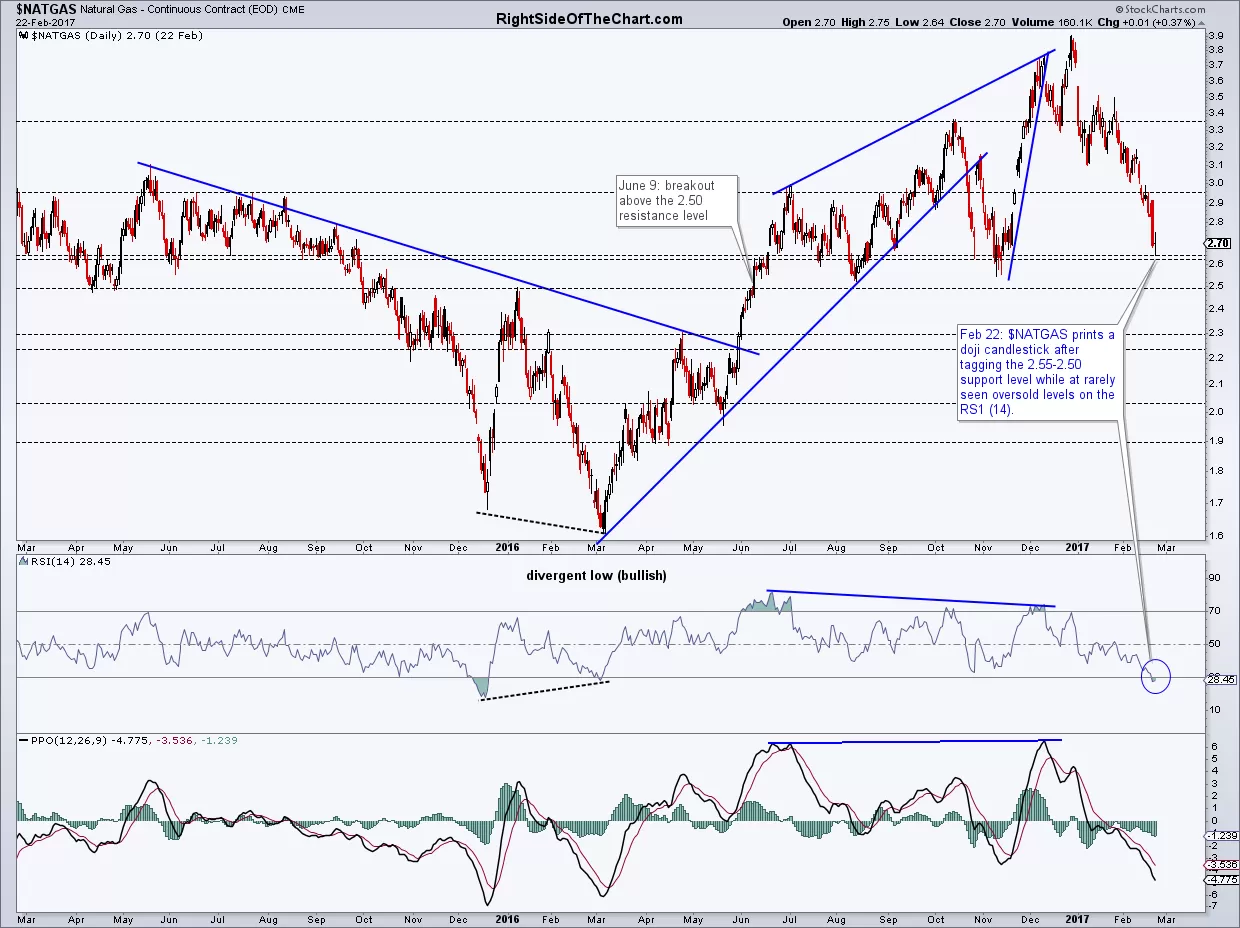
As such, I’m going to let the position ride for now with a stop slightly below 2.50 with two tentative price targets at 2.78 & 2.83 (those are the actual resistance levels, my sell limit order(s) will be placed slightly below if I decide to book partial or full profits if /NG gets there). Those resistance levels, along with a potential downtrend line that could be the catalyst for the next thrust higher if taken out, is shown on the 60-minute chart of /NG below, along with a daily chart of $NATGAS (Nat Gas Continuous Contract) printing a nice doji off a comparable support zone* ($NATGAS prices will differ from /NG futures, which are often priced at a premium or discount to spot prices). Also note that $NATGAS is an EOD (end-of-day) chart. Therefore, the $NATGAS chart below only reflects yesterday’s closing candle & not any of today’s trading.