
/RTY (Russell 2000 Smallcap Index futures, or IWM, TNA, etc..) will trigger a buy signal on a break above this 10-minute chart downtrend line (bullish falling wedge pattern) & the 1753 resistance level.
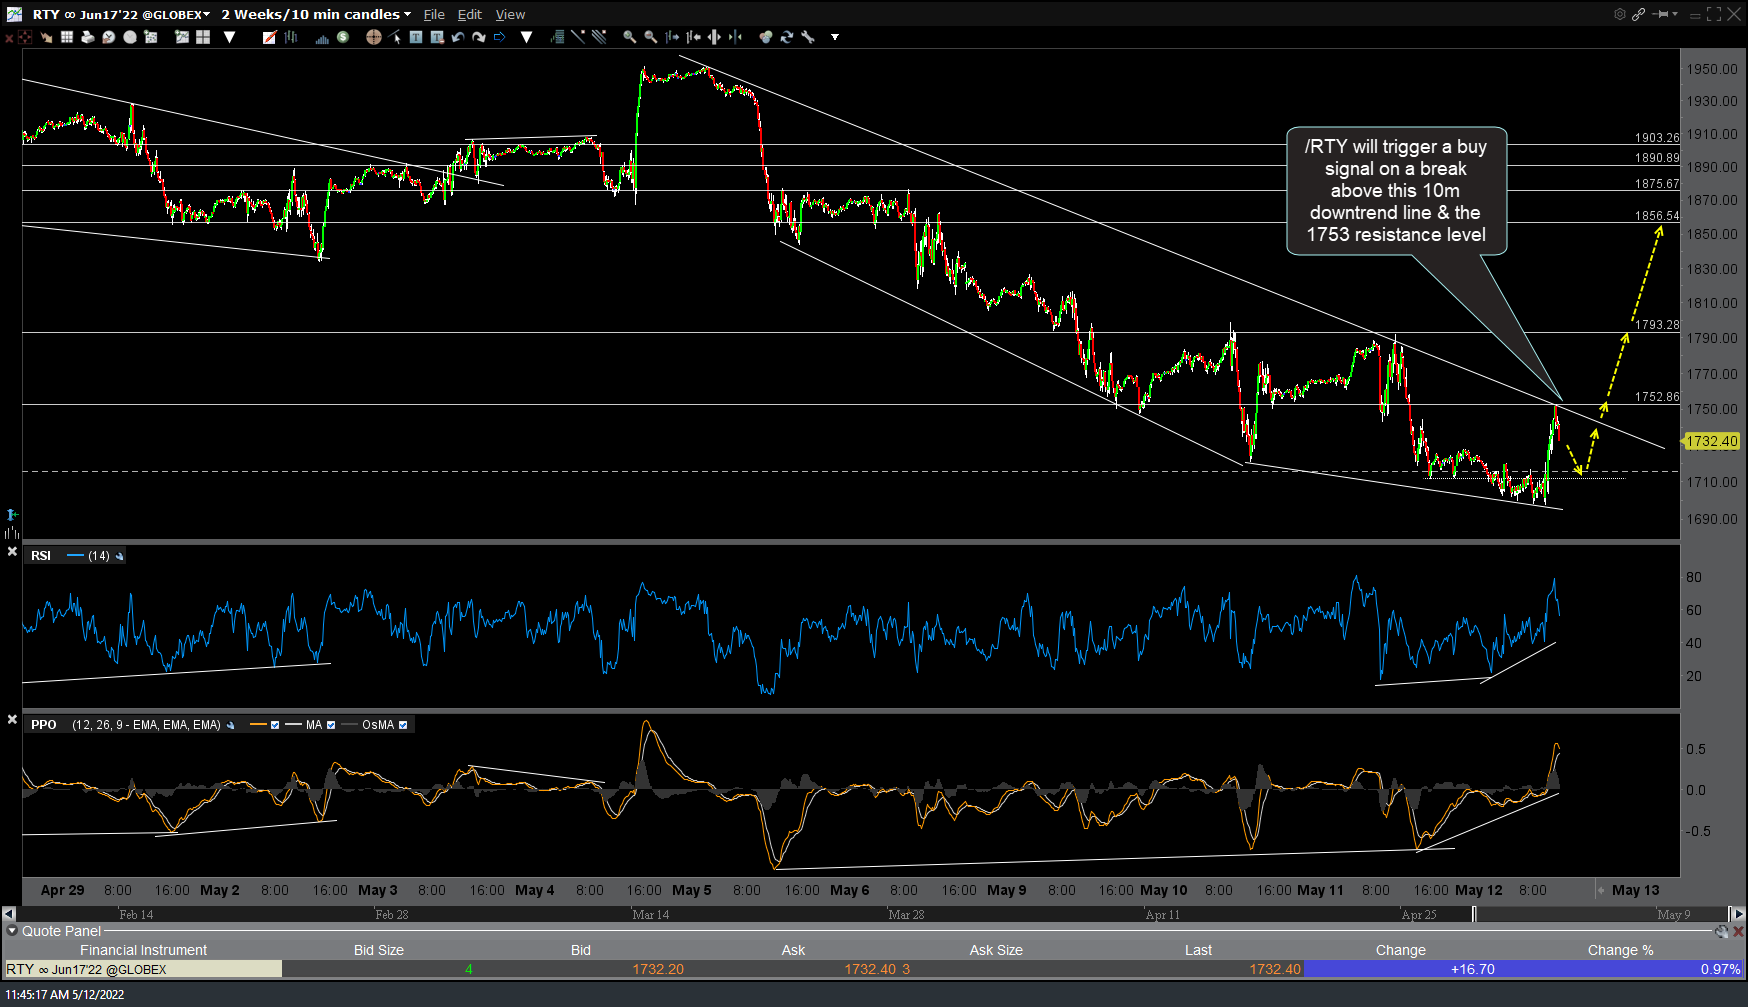
RTY 10m May 12th
/NQ (Nasdaq 100 futures) made a brief intra-candle pop/failed attempt to break above the 12000 resistance level on this 10-minute chart with the next pop of that level likely to stick (buy signal to come on a pop above today’s high on /NQ, QQQ, TQQQ, etc..). Should /NQ fail to take out the significant 12100ish resistance (and the comparable 297ish resistance on QQQ) along with a solid break and close below today’s lows, that would be quite bearish & potentially open the door for a swift move down to the next target(s) on the weekly charts of QQQ and/or SPY. Stay nimble!
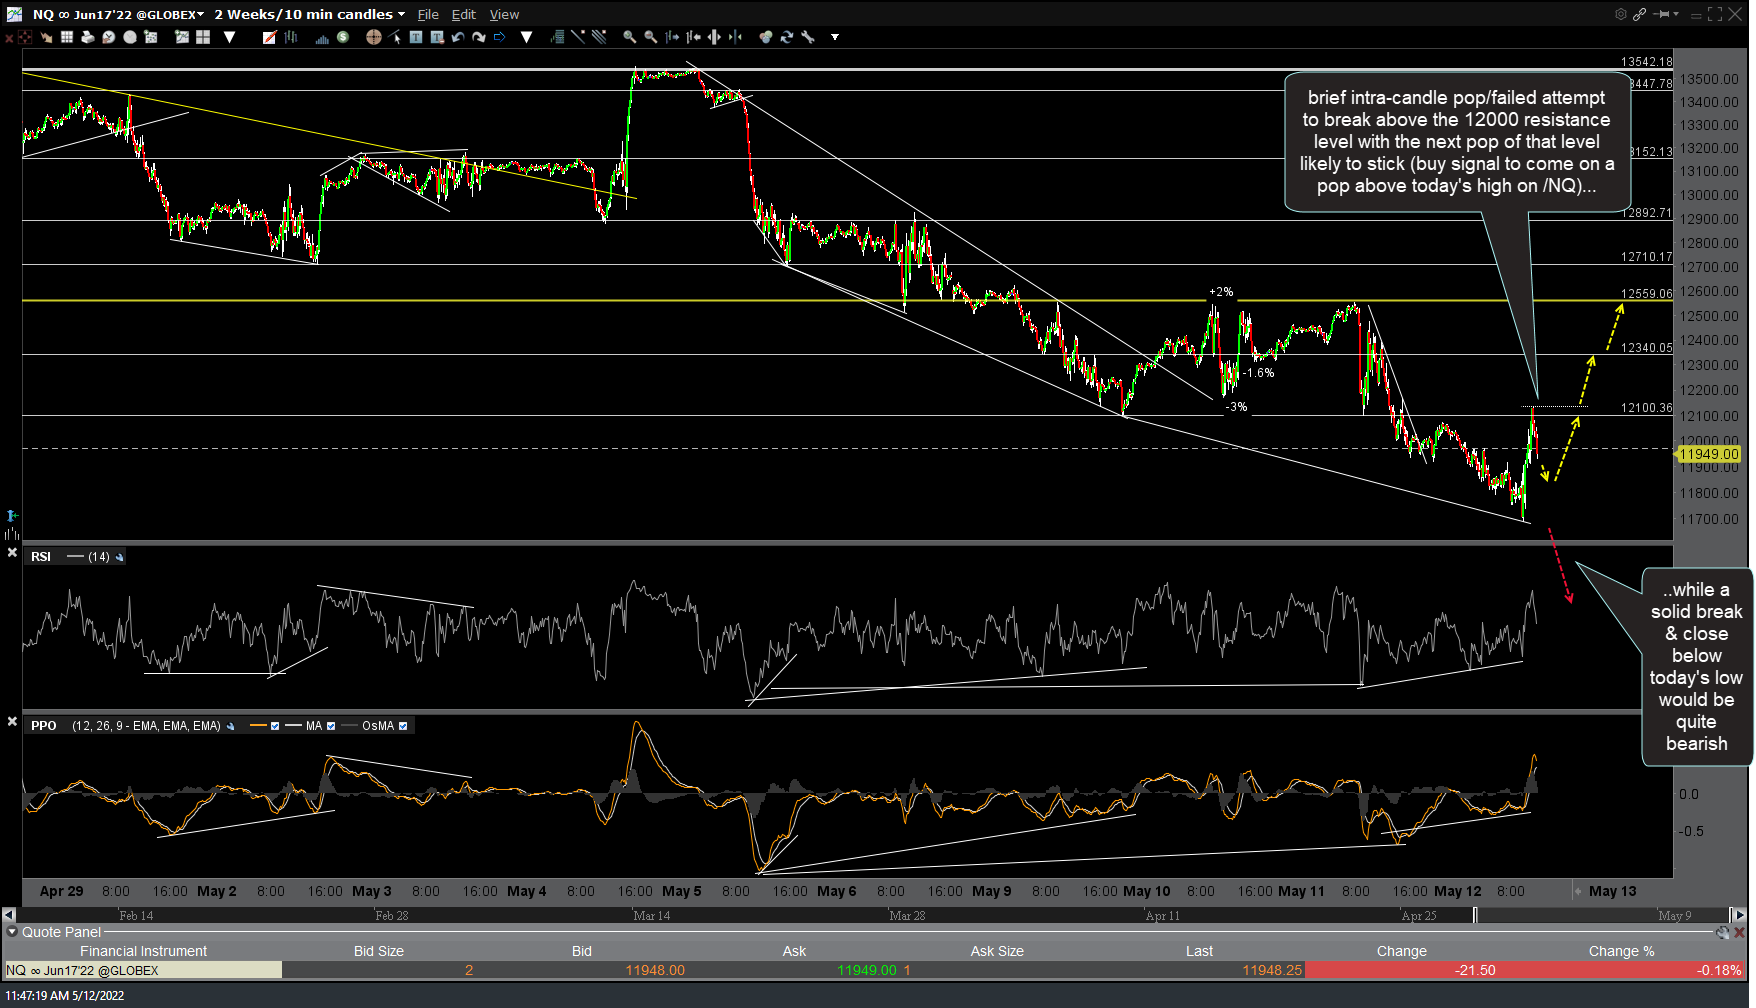
NQ 10m May 12th