
The first chart below from Friday shows the scenario leading up to & following the much-anticipated FOMC rate decision due out tomorrow at 2 pm EST.
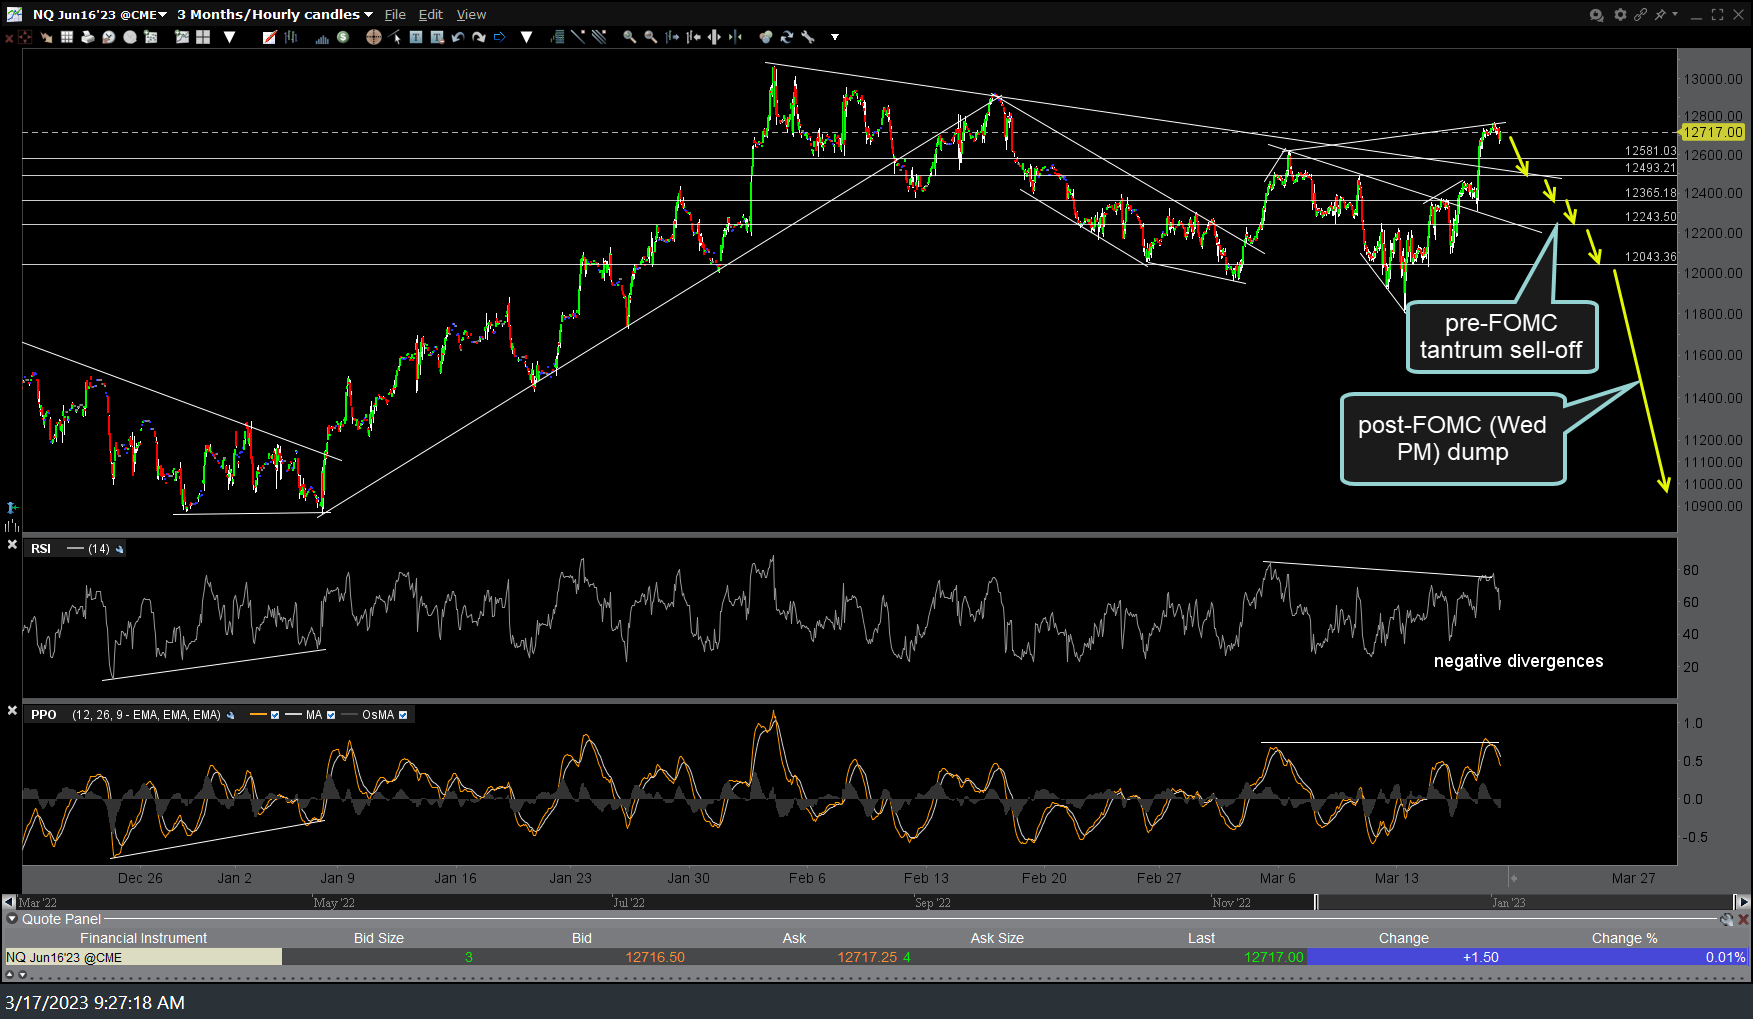
NQ 60m March 17th
From there, /NQ (Nasdaq 100 futures) went on to fall, hit, & bounce off the first target (downtrend line off the late Jan highs) to extend the negative divergences that were already in place with that reaction (bounce) off the trendline most likely having now fully run its course IMO & the next sell signal/objective short entry to come on a break below the uptrend line off last week’s lows.
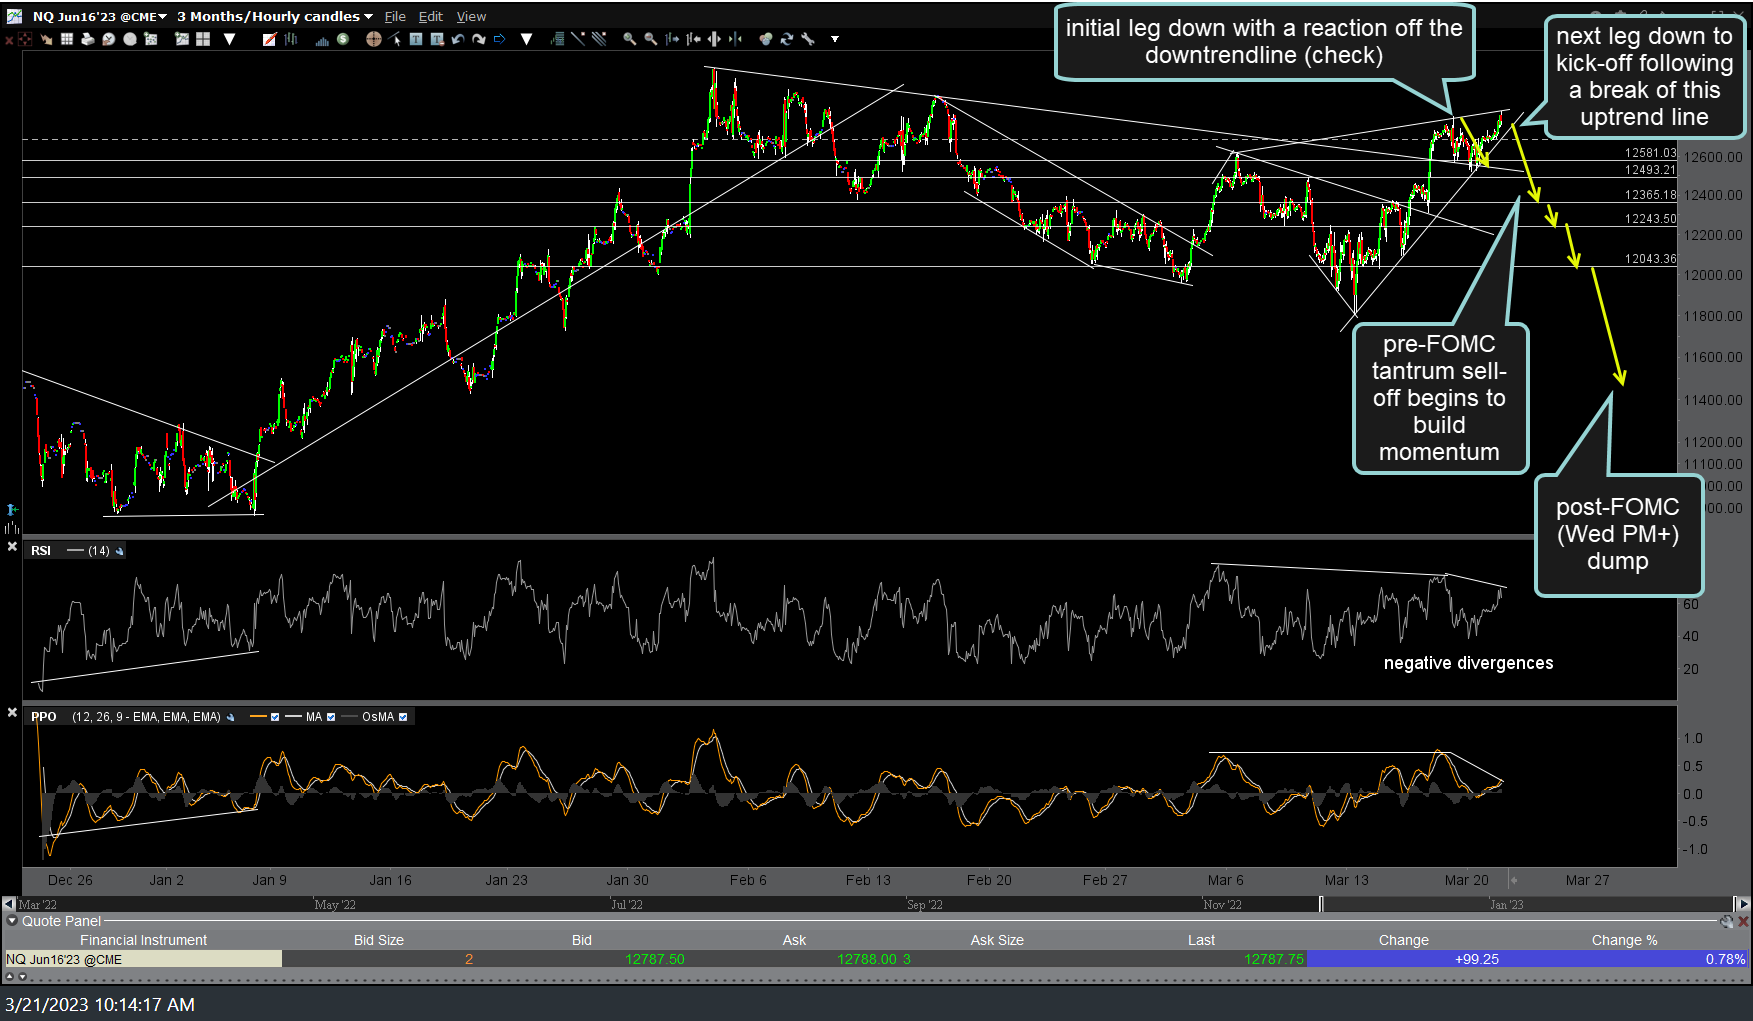
NQ 60m March 21st
Should this scenario continue to play out, a solid break below last week’s lows on all of the major stock indices would most likely open the door to a much longer & deeper sell-off. Should the market continue to rally much beyond today’s highs (5%+) following the FOMC announcement, that would certainly chip away at the bearish case with the S&P 500 solidly moving back above its primary bear market downtrend line & 200-day moving averages. As of now, the charts still appear to be more supportive of the former vs. the latter scenario but I will let you know if & when that appears to be changing.