
I just returned home after taking the week off to visit family on the other coast & have been offline since. In catching up on the charts, I can see both QQQ & /NQ just broke out above bullish falling wedge patterns after putting in divergent lows on the 60-minute chart. This strong increases the odds of a tradable rally in the coming days. Starting with the QQQ 60-minute chart, the next buy signal/objective long entry will come on a break above the 267.50ish resistance level which has, so far, capped today’s rally. All marked levels on this chart are potential price targets (where a reaction is likely upon the initial tag of each) with a max. bounce target just below the 280ish resistance level.
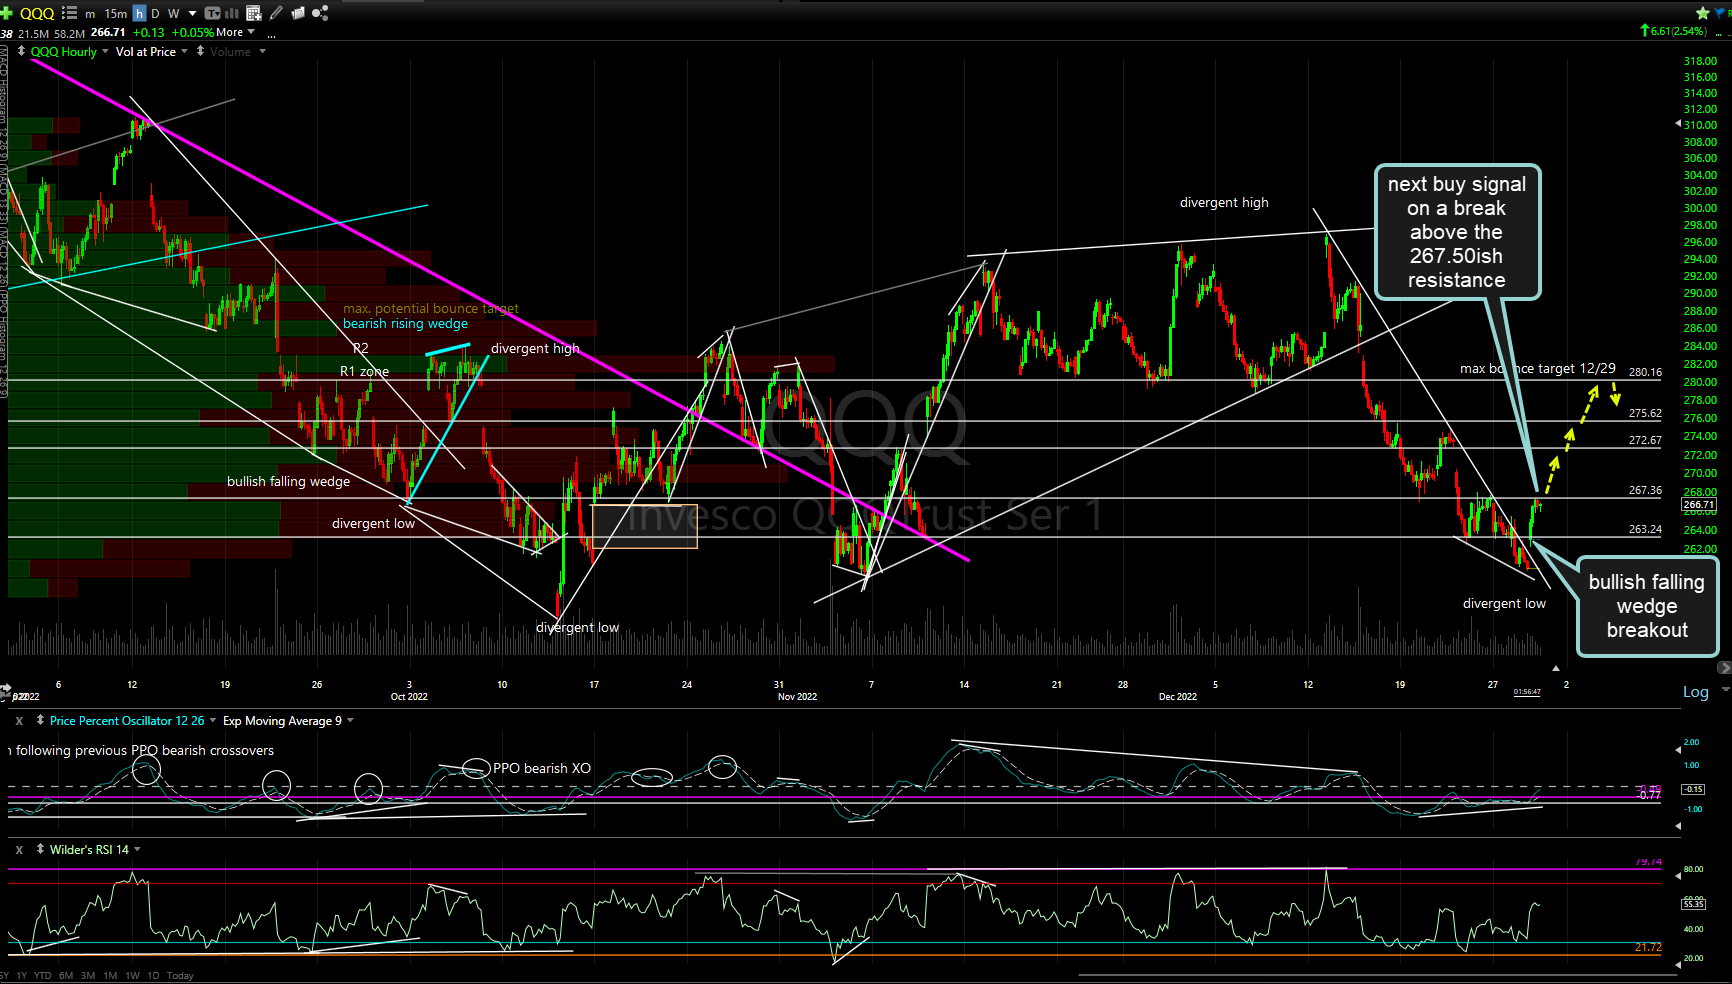
QQQ 60m Dec 29th
Likewise, next buy signal for /NQ (Nasdaq 100 futures) will come on a break above the comparable 11045ish resistance level with a max. bounce target around the 11630ish resistance (same T3 & final target as the previous bounce trade that reversed off T1). Basically, the next buy signal on the $NDX will come on a solid break above today’s highs, ideally after some consolidation and/or a minor pullback to help alleviate the very near-term overbought conditions. 60-minute chart below.

NQ 60m Dec 29th
Updates on some of the other recently highlighted trade ideas such as gold, silver, crude oil, nat gas, Treasuries, etc.. will follow as soon as I’ve had time to thoroughly review the charts.