
On the daily chart of QQQ below, we have “potential” but unconfirmed positive divergence as QQQ tests key support (recent lows + bottom of T1 zone) in the pre-market session. My preferred scenario has little to no bounce today with a break & solid close below the recent lows while my alternative scenario (short-term bullish, long-term bearish) has QQQ mounting a relatively minor counter-trend rally before taking out the recent lows & heading down to T2 on the weekly chart.
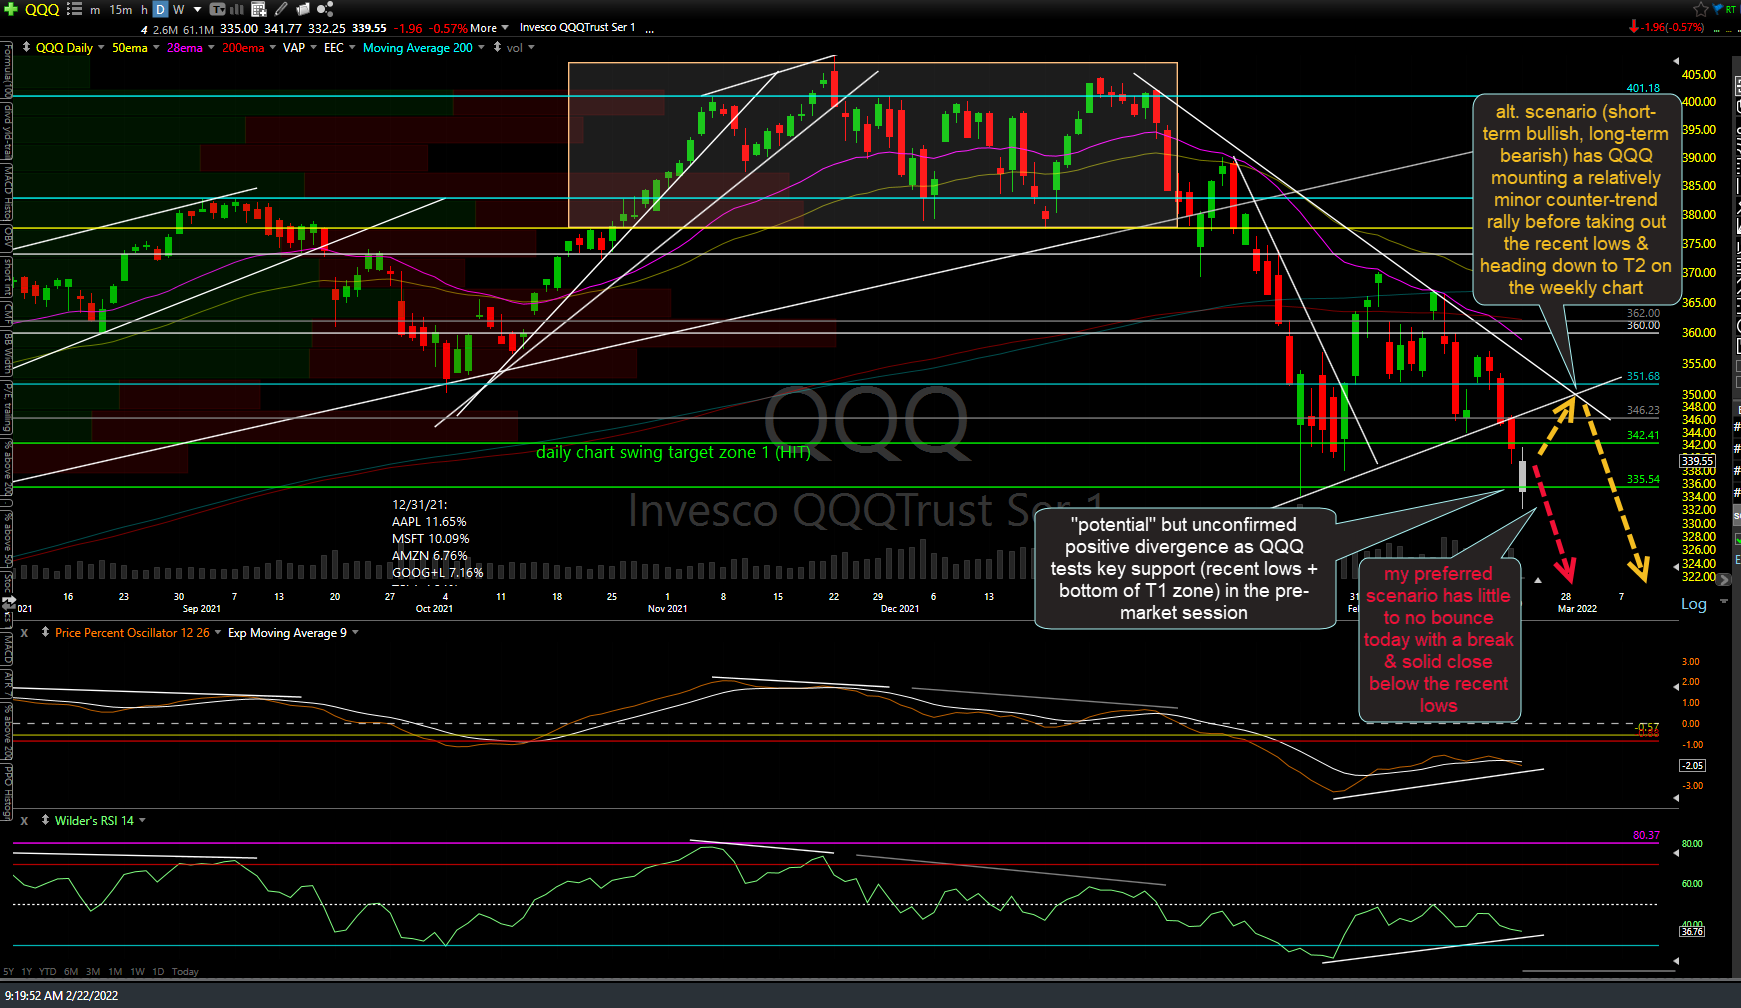
QQQ daily Feb 22nd
There’s also positive divergence on the 60-minute chart of QQQ although ONLY in the pre-market session, not yet during the regular session. Also, note that there are not any divergences on /ES or SPY 60-minute charts as the S&P 500 did not test those previous lows in the Globex holiday session yesterday nor in the pre-market session today.
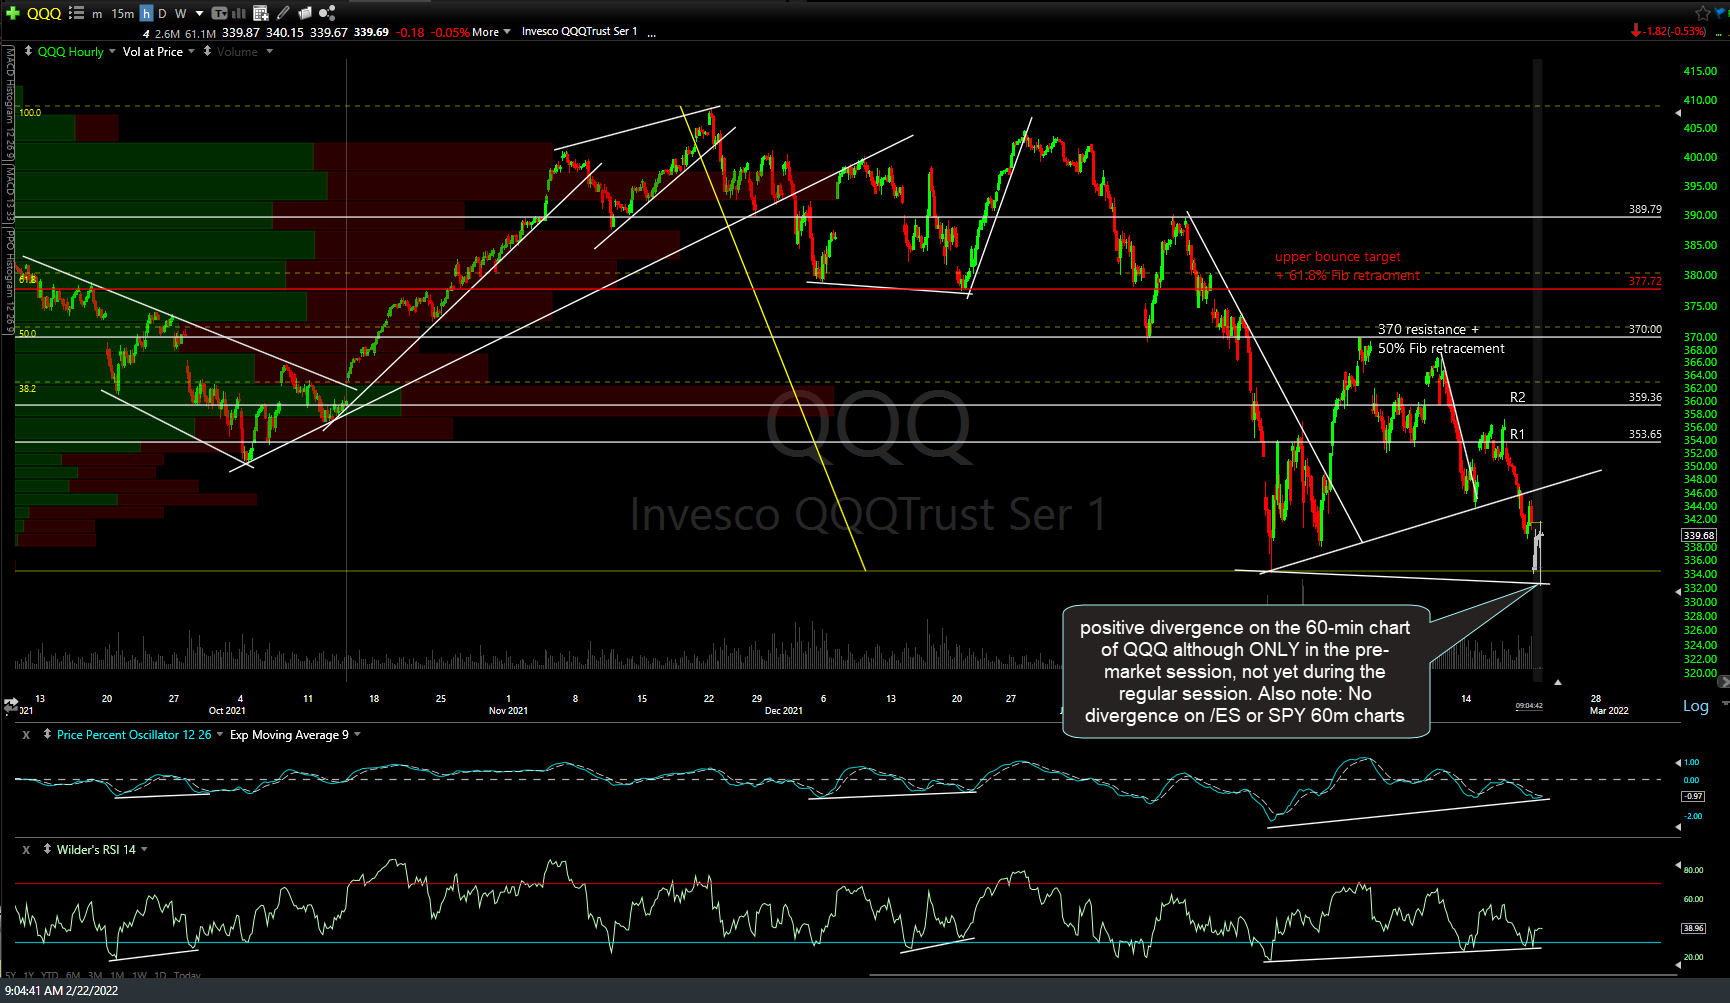
QQQ 60m Feb 22nd
There are positive (bullish) divergence on this 120-minute chart of /NQ with a successful test of the Jan 24th low, at least so far. Should these divergences play out for a rally beyond the key 50% Fib + 14258 price resistance, that would be bullish while a failure of the divergences (PPO & RSI take out the previous lows) would be quite bearish.
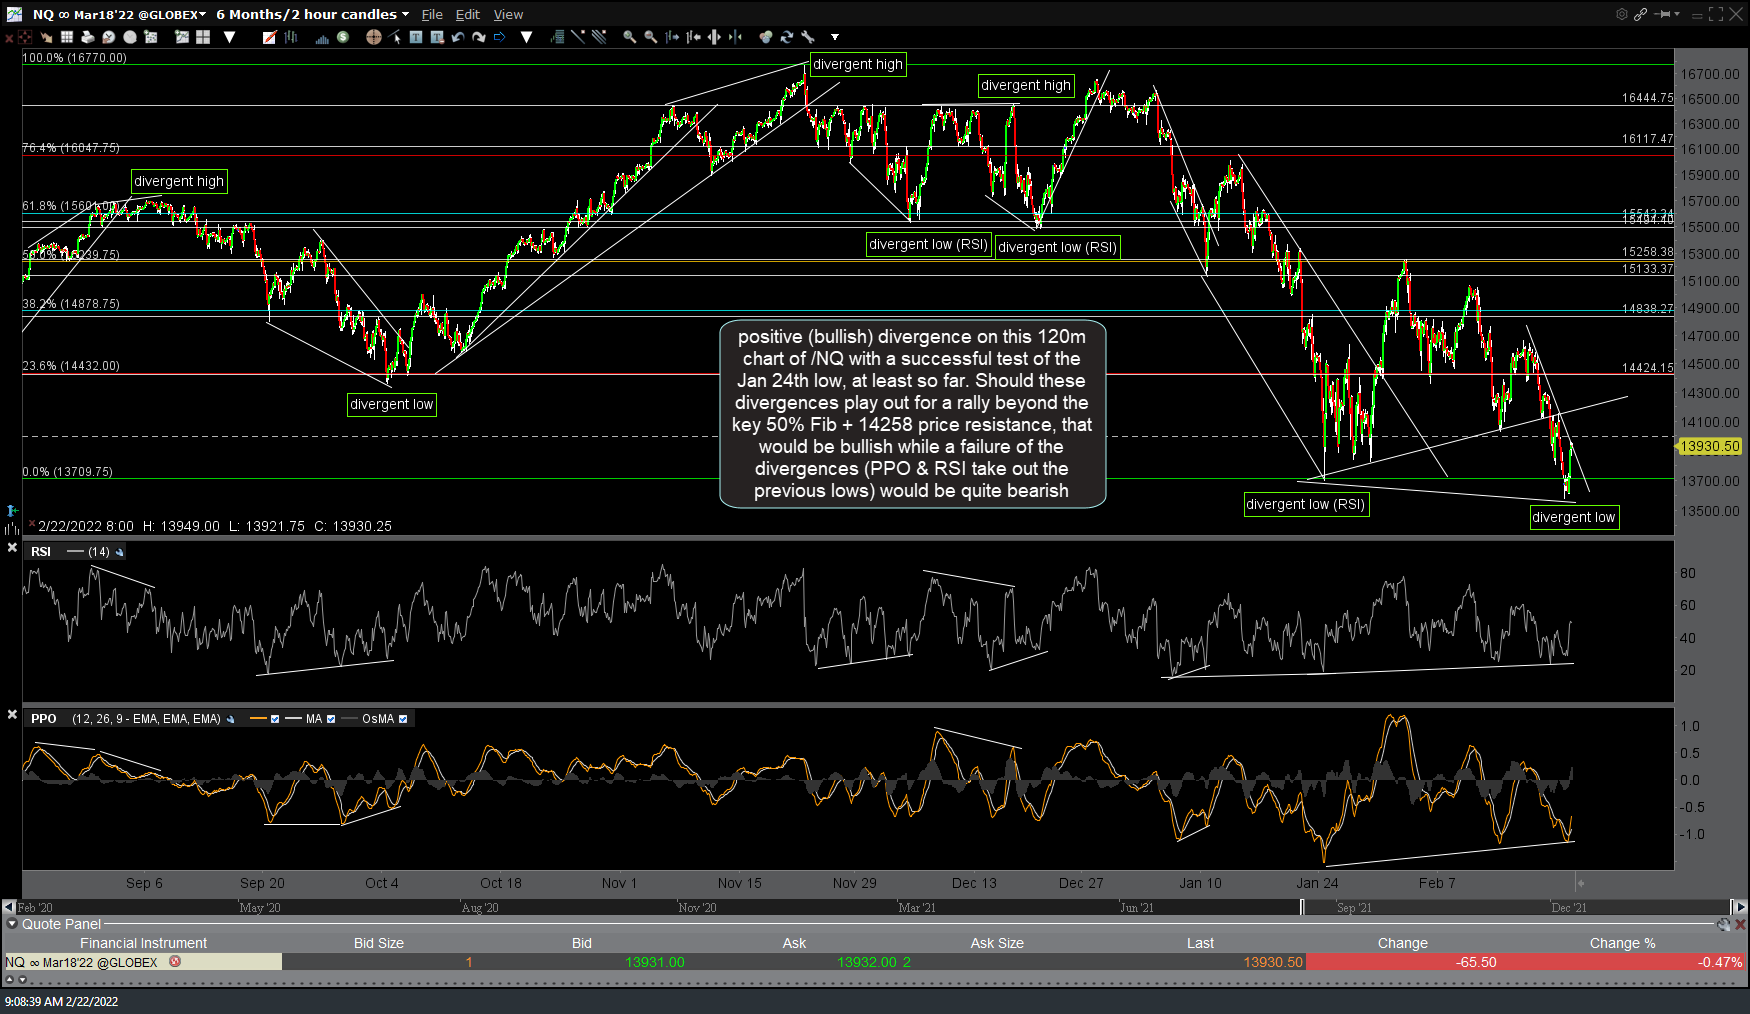
NQ 120m Feb 22nd
/NQ is also trading at minor downtrend line resistance with positive (bullish) divergence on this 60-minute chart following a test of the recent lows during yesterday’s low-volume holiday (i.e.- unofficial) session. Again, those divergences and (so far) successful test of the recent lows certainly has the potential to spark a more meaningful rally. However, should that divergences get taken out with a solid drop below the January 24th lows, that would be quite bearish & significantly increase the odds of my second price target on the QQQ weekly chart being hit & hit relatively soon, as well.
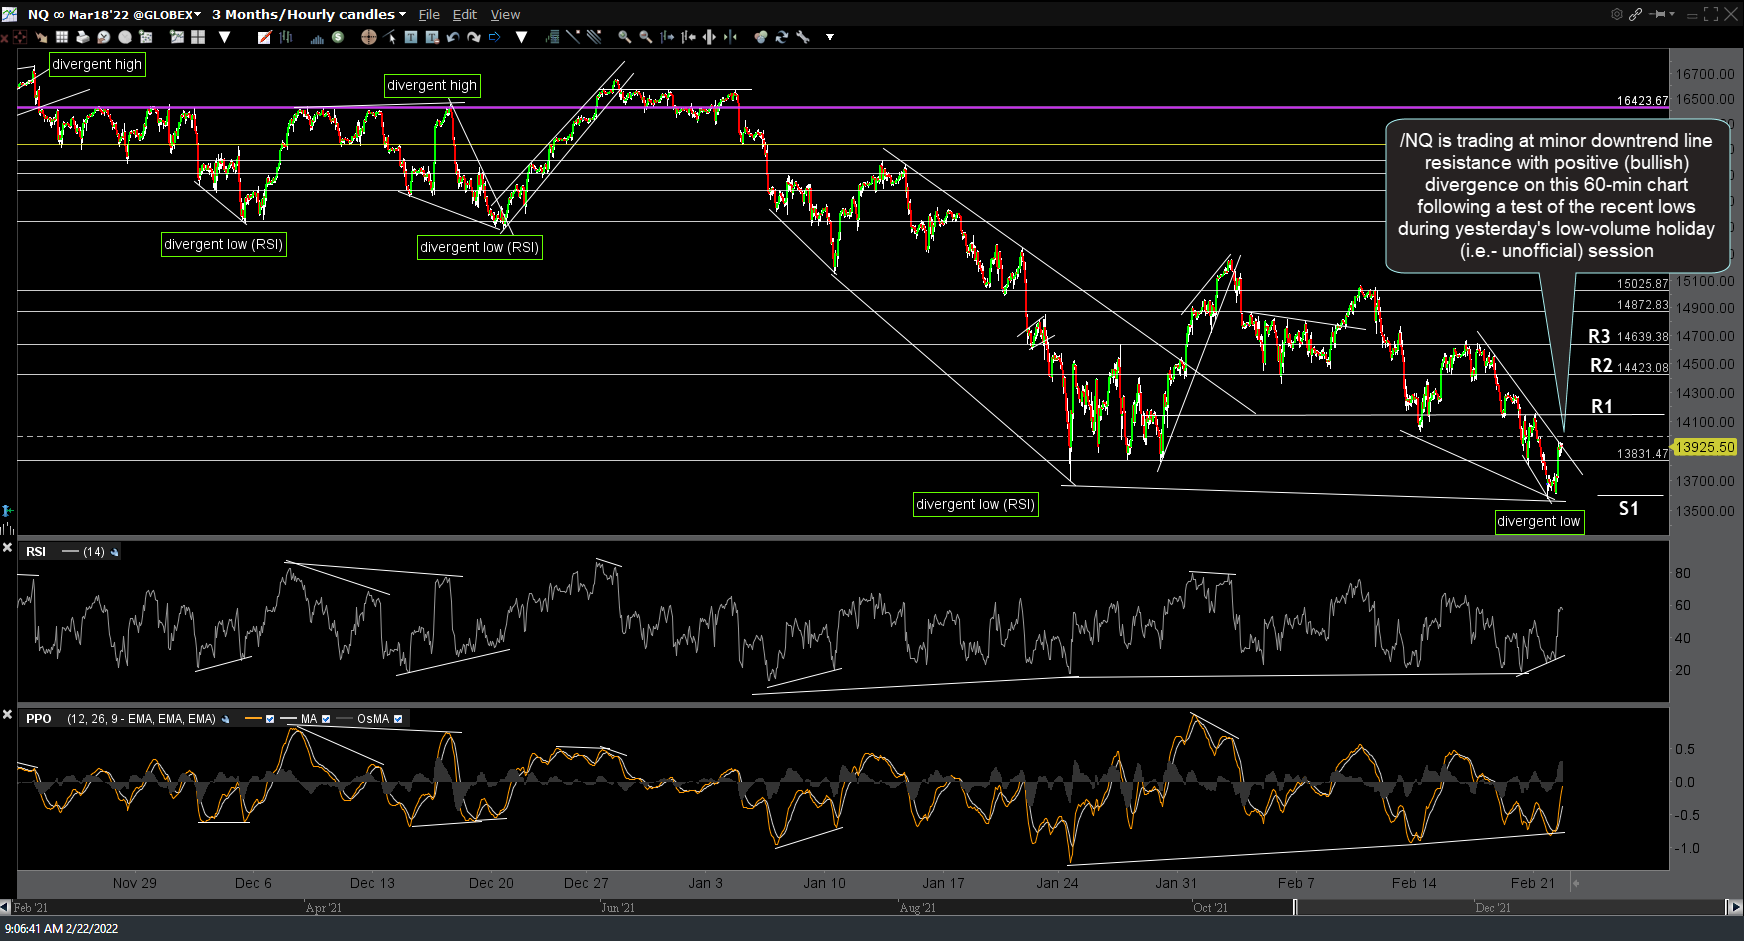
NQ 60m Feb 22nd