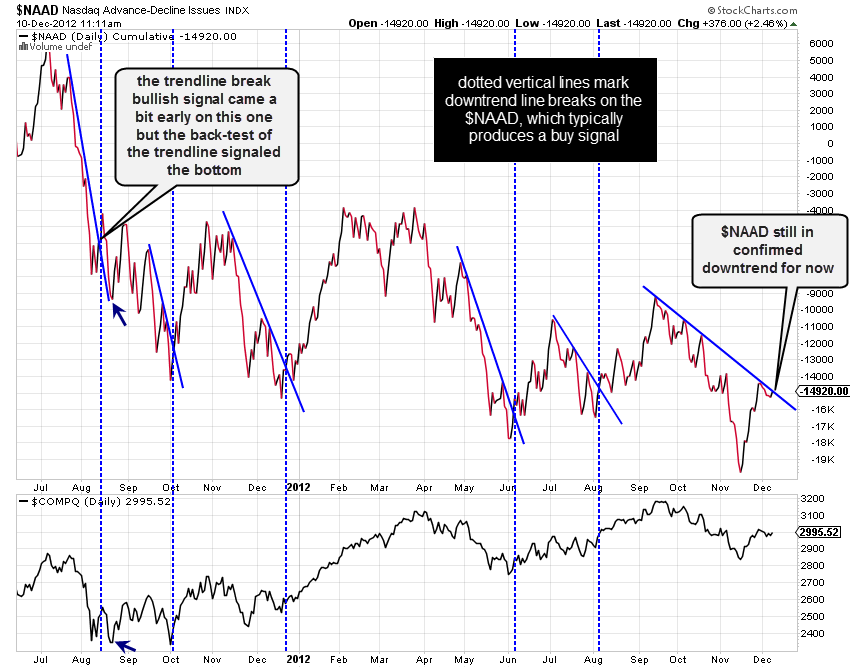
In the past I’ve discussed how the $NAAD (advancing vs. declining stocks in the Nasdaq Composite Index) has been a pretty reliable indicator for signaling trend changes. In fact, the last time I posted this chart was on December 10th, just before it issued a solid buy signal by breaking above the Sept – Dec ’12 downtrend line (a signal that I unfortunately did not act on personally or make a follow-up post as I typically disregard most of the trading signals going into the last few weeks of the year due to the low volume surrounding the holidays). Here’s that previous chart which was posted on Monday Dec 10th, with the most recent data as of Friday Dec 7th:
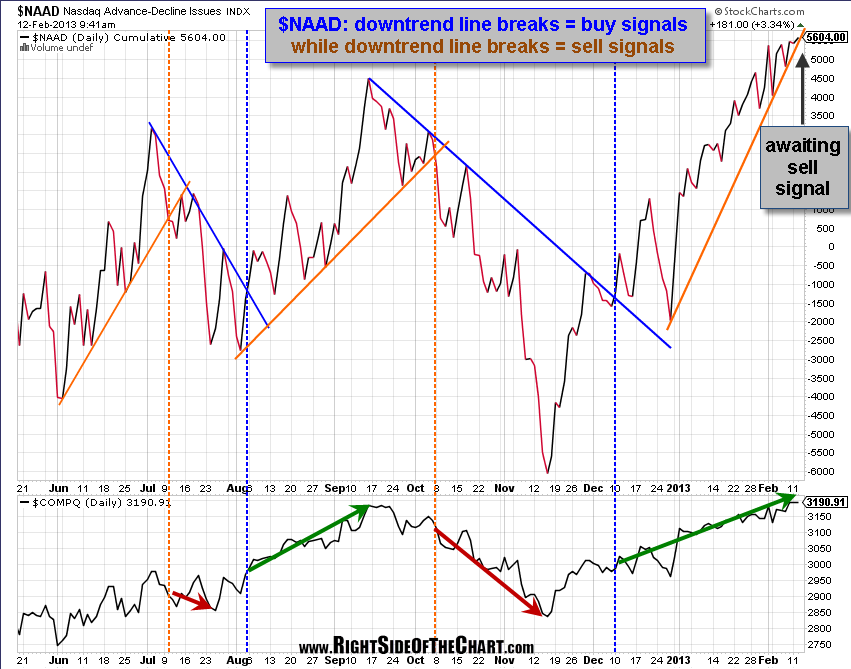
Hindsight is 20/20 and if I could go back, I would have given this buy signal some more weighting in my market analysis and overall positioning but although I can’t do that, I can point out that the current uptrend (which began literally the day after that last $NAAD was posted) looks very much to be in it’s final stages and likely to give a sell signal (break below the uptrend line) very soon. As you can see from this updated chart (which I zoomed in a bit) compared to that previous chart, sometimes these signals are only good for a relatively shallow pullback (or bounce), such as that sell signal issued back in early July but even then, although the market only pulled back to a level slightly below where the signal was given (red arrow), it still would have allow longs to exit a market that chopped around in a sloppy sideways trading range for about a month. The red and green arrows at the bottom mark the maximum gain/loss for the Nasdaq following each of the last few buy and sell signals. Again, we do not have a sell signal as of yet but looking at the scope and duration of the current uptrend as well as the fact that the $NAAD seems to be stalling out here, tells me that we are likely to get a sell signal (trendline break) soon. Sometimes we do get a buy or sell signal followed shortly by a backtest of the recently broken trendline so that is always a possibility. Here’s the updated $NAAD daily chart (through yesterday’s close, as these are end of day charts):

