
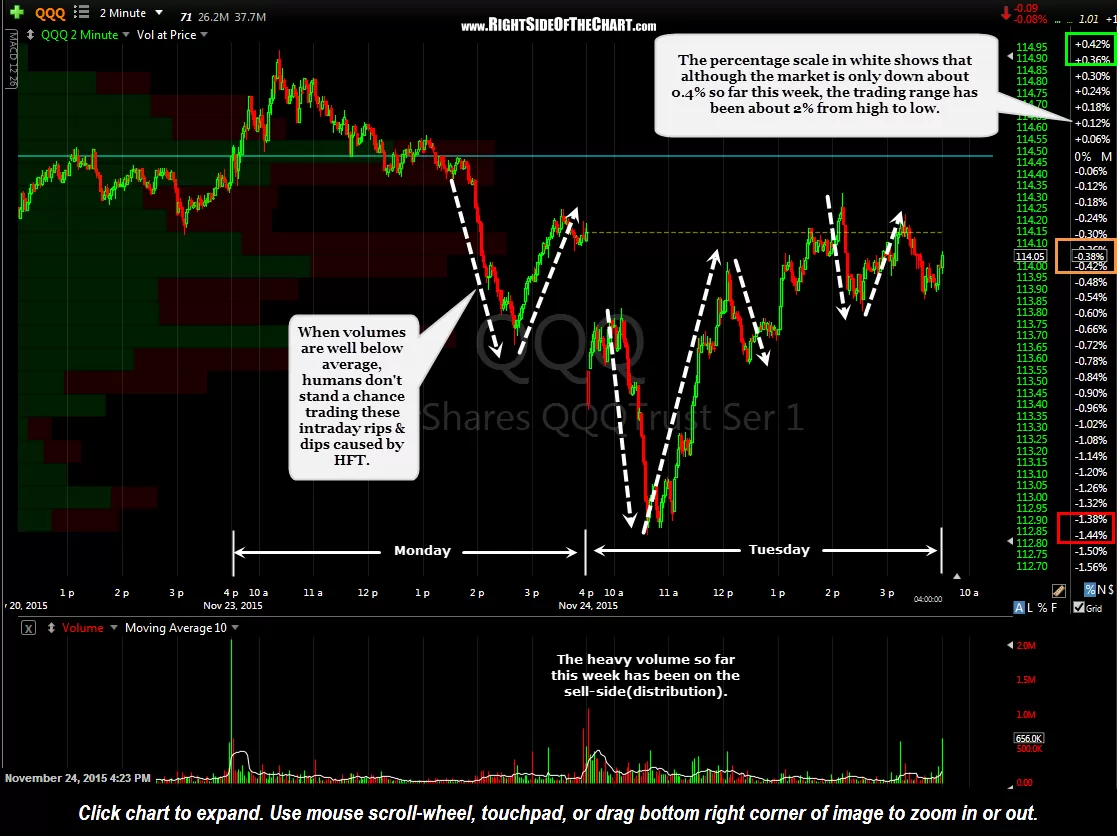
I’ll be leaving town for the remainder of the week & don’t plan to post any market or trade updates until I return. Even if I wasn’t leaving town, as I’ve stated several times in the Trading Room recently, that the abbreviated Thanksgiving holiday trading week (US equity markets closed Thursday & close early on Friday) are notoriously plagued with erratic price swings that tend to trigger false whipsaw buy & sell signals as well as run any nearby stop-loss orders on your positions, or at least that has been my experience in the past. As such, I tend to be very selective on entering any new positions & will often widen my stops during the Thanksgiving trading week. This 2-minute chart showing the price action in QQQ so far this week helps to illustrate that point.
-

- QQQ 2 minute Nov 24th
-

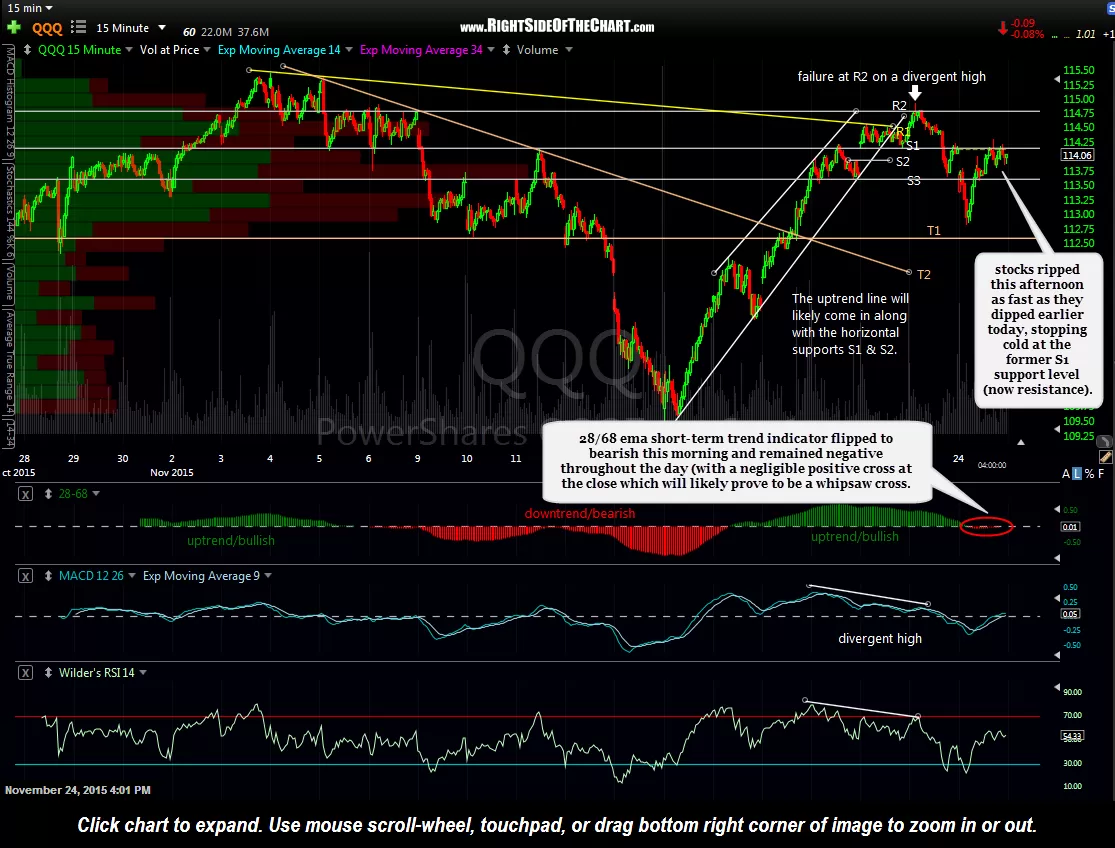
- QQQ 15 minute Nov 24th
A member in the Trading Room asked the following question as I was drafting this final market update for the week so I figured that I’d just copy & paste his question & my reply which summarizes some of the recent market developments & includes my thoughts as to where the market is likely headed in the near-term.
Q: Randy, earlier today you said “but it appears to me that the charts also confirm that a reversal in US equities is most likely in the early stages”. Is this a topic that you could expand on a little further? I’ve heard others in the industry say the same thing but there are no charts to explain why.
A: I was just about to post one last update on the markets for the week before I leave town in a few hours. On the 15-minute QQQ chart that I’m posting, there are a few things that indicate that the bounce off the Nov 16th lows has run its course with a new (short-term) downtrend likely now underway:
1) Prices broke below the ascending price channel late Friday, briefly ripping higher only to fail at the R2 level.
2) That breakdown of the ascending price channel was likely a near-term top as it was confirmed via a divergent high (i.e.- negative divergences on most price & momentum indicators & oscillators, again, on the 15-minute time frame).
3) The 28/68 ema trend indicator (shown as a histogram on that 15-minute chart) signaled a bearish cross (sell signal) today, following an extended bullish period that confirmed the prior uptrend. -END REPLY- (additional note: The 28/68 ema histogram made a marginal cross back into positive territory right before the close, printing a negligible positive value of 0.01, which is likely to prove to be a whipsaw signal unless the QQQ can move considerably higher tomorrow.)
TO ALL: Happy Thanksgiving to those who celebrate it & to all others, enjoy the rest of your week & best of luck on your trades!
-RP